Received 12 Feb. 2024
Received in revised form 04 Mar. 2024
Accepted 12 Mar. 2024
Available on-line 26 Apr. 2024
Keywords: Camera; temperature effect; temperature compensation; compensationmodel; thermal image drift.
Thermal image drift is observed in prevalent industrial-level cameras because their optomechanical design is not optimised to reduce this phenomenon. In this paper, the effect of temperature on industrial-level cameras is investigated, focusing on the thermal image drift resulting from ambient temperature changes and warming-up process. Standard methods for reducing thermal image drift are reviewed, concentrating on the lack of repeatability aspect of this drift. Repeatable thermal image drift is crucial for applying a compensation model as random thermal deformations in sensors cannot be compensated. Moreover, the possible cause of this issue is explored, and novel optomechanical camera modifications are proposed that maintain the thermal degrees of freedom for the deforming sensor, limiting the lack of repeatability aspect of thermal image drift to a low level. The improvement is verified by conducting experiments using a specialised test stand equipped with an invar frame and thermal chamber. Considering the results from the application of the polynomial compensation model, the standard deviation of the central shifts of image drift is reduced by ×3.99, and the absolute range of image drift is reduced by ×2.53.
For the past several years, research regarding engineering, scientific, and consumer-level imagining-based applications has grown considerably [1–3]. The machine vision market is estimated to be valued at 11.0 billion USD in 2021 and is predicted to reach 15.5 billion USD by 2026 at a compound annual growth rate of 16% [4]. This growth is caused by the development of image processing algorithms and hardware in parallel [5, 6]. Machine vision applications are now present in areas such as optical character recognition, machine inspection [3, 7], retail (e.g., self-service shops) [6], warehouse logistics [6, 8], medical imaging [9–11], self-driving vehicles, 3D digitisation (including structure-from-motion, photogrammetry, and other 3D scanning techniques) [3,12-14], motion capture [15-16], surveillance [17], fingerprint recognition, and biometrics (including gesture and face recognition) [18, 19]. Machine vision applications use visible light field detectors (camera systems) to obtain information about the world. The quality of measurements obtained with image processing algorithms is strictly related to the quality of the information provided by cameras. The final representation of an observed scene is generally a result of scene illumination, object reflectance and shading, lens system, acquisition parameters, and environmental conditions (temperature, humidity, and vibration) [1, 5, 11].
In a majority of measurement applications, the vision system requires a mathematical description between the observed scene and image coordinates. Camera calibration process estimates the necessary parameters that describe such a relationship. The algorithms used during the camera calibration process are constantly developed and allow for a precise image-based measurement and feature extraction [14, 20, 21].
In a wide variety of measurement applications, the camera system is calibrated in a laboratory using specialised calibration artifacts in laboratory-controlled environmental conditions [20–22]. The other approach is to conduct calibration at the measurement location. Lowreprojection error values are obtained if intrinsic and extrinsic camera parameters, matrix dimensions, matrix to lens relative position and orientation, are estimated depending on the used lens system [23], often with values to the tenths and hundredths of a pixel. The key assumption in both aforementioned approaches is that the calibration parameters remain unchanged after the calibration process. This assumption is not always true, as there are factors that affect the camera calibration and frames capturing processes. For instance, temperature is the main factor that often affects calibration parameters [24, 25].
Temperature influences a camera system in two ways: the warming-up process and changes in ambient temperature. The former is a thermodynamic process in which the camera itself is a source of heat. Depending on the camera model used, the camera can be treated as a heat source with power from tenths to several Watts for most machine vision applications. The warming-up process increases the camera temperature and ends once the camera-lens-mount system reaches a thermodynamically stable point. During this process, the temperature of the camera (typically measured near the sensor) can increase by up to a dozen of degrees Celsius [26–28]. The heat produced by the warming-up camera electronics is not only absorbed by the camera itself but also by the camera casing, camera mount, and lens. This heat flux thermally deforms these structures by thermal expansion of the used materials, which in turn leads to more undesirable results: the thermal image drift and deformation. The warming-up process of camera usually lasts about several minutes to 2 h, depending on the electric power consumption, camera dimensions, lens dimensions, camera mount, and environmental conditions. The observed thermal image drift can be from the tenth part of a pixel to several pixels [19, 25, 27, 29].
The second influence of temperature on a camera system is the change in ambient temperature. The changes in ambient temperature cause a heat flux that additionally changes the camera system temperature. Such changes in temperature cause additional undesirable thermal image drift proportional to the value of temperature change.
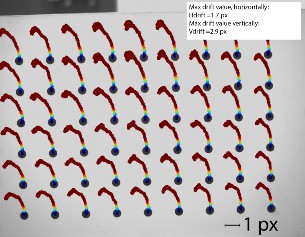
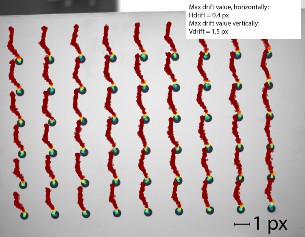
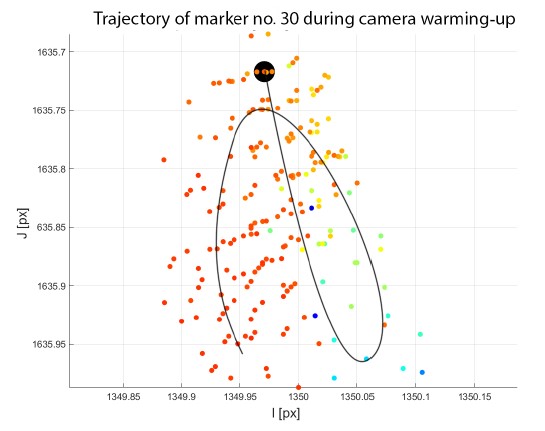
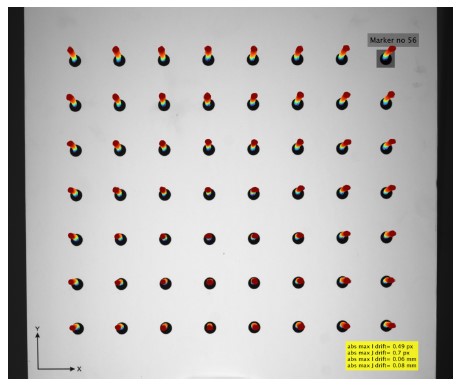
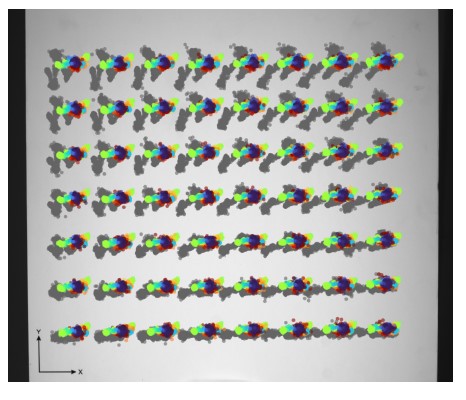
One of the most complex problems concerning thermal image drift is its lack of repeatability [19, 30, 31]. To illustrate this phenomenon, a result of a simple experiment is presented in Fig. 1, which illustrates the centres of markers trajectories extracted from images captured by the constantly recording camera during its warming-up process in two repeated experiments [Fig. 1(a) and (b)]. The camera IDS UJ-6280SE-M-GL-R3 [32] with a Fujinon HF25SA-1B lens [33] is positioned in front of an artifact consisting of matrix 6x9 feature points (black circle-shaped markers) printed on a white plane. The centre of each marker is calculated using suitable image processing techniques [21, 34, 35]. The camera temperature is recorded simultaneously to image acquisition (the aforementioned camera model supports internal temperature sensors, located near the camera sensor). Each point denotes the centre of each marker calculated for every captured frame, and the marker shifts are scaled x100 for better visualisation. The background of this picture is the first captured frame (immediately after camera initialisation). The camera temperature is marked by the colour of each marker centre (blue: the coolest at around 24◦C immediately after initialisation; red: the warmest at around 46◦C at the end of the experiment).
The registration is repeated, and the camera is cooled down after each turn. The apparent difference in the feature trajectories can be observed. Note that the experimental conditions are stable: the ambient temperature is constant, and the camera is left to cool down after each series. The output from this experiment illustrates the lack of repeatability issue concerning image drift. This experiment is repeated several times, and the results are different with each attempt. The same camera behaviour is observed when camera is subjected to changing ambient temperatures. This issue is described in detail in section 3 (see also Fig. 10 and 11).
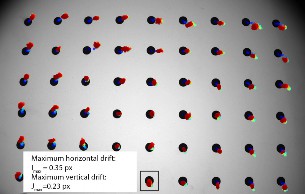
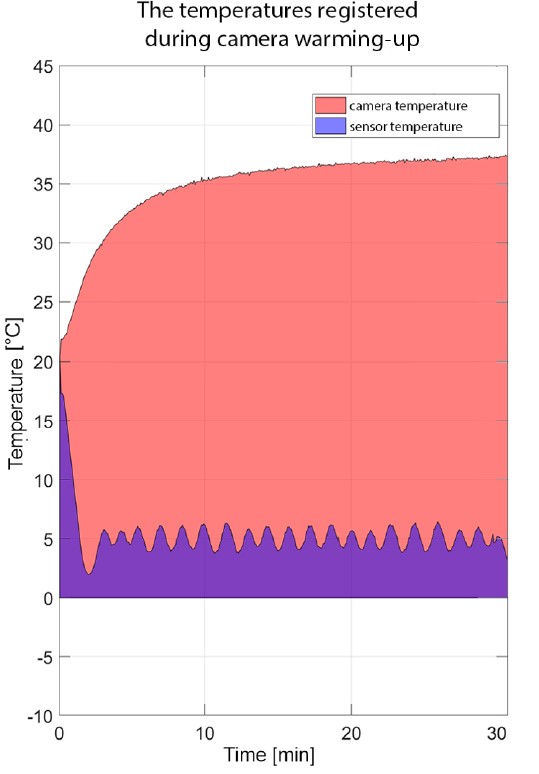
In the vast majority of applications, thermal image drift is an undesirable phenomenon that deteriorates the information provided by the camera system. This drift can be reduced through two main approaches: hardware and software. The hardware methods include optic athermalisation, usage of specialised cameras with a controlled sensor temperature, and thermal insulation. None of these methods completely eliminates thermal image drift. The lens athermalisation techniques maintain unchanged focus (resulting in small zoom changes) and eliminate colour chromatic aberrations of the optical system [36–38], which is insufficient in many applications as the effect of thermal image drift on camera calibration parameters still persists. Additionally, specialised cameras with a temperature-controlled design exist to maintain a constant temperature of the sensor. They offer an improvement in photometric parameters, such as colour representation and signal-to-noise ratio, but thermal drift still persists; for example, camera Vieworks VP-8MC [39]. This model allows for forcing the camera to maintain the set image sensor temperature. Fig. 2 and 4 illustrate the thermal image drift during the warming-up process of this camera. The sensor temperature is set to default value of 5◦C. The camera housing reaches the stabilised temperature 37◦C after 30 min (Fig. 3). The ambient temperature is 24◦C. The thermal image drift is still evident despite the presence of the temperature-controlled camera sensor.
The other approach for reducing thermal image drift is mathematical modelling and calculating the temperature compensation model. Such methods have been proposed in several studies. Handel in Refs. 26, 27 determined the temperature compensation model using a system identification approach. The proposed method allowed reducing the temperature-induced image drift during the warming-up process and changes in ambient temperature. The temperature deviation is estimated using a linear model calculated through only the intrinsic parameters of the camera calibration while disregarding the extrinsic parameters. Podbreznik and Potočnik [28] proposed another linear compensation model, assuming that the changing temperature affects only the extrinsic camera parameters, i.e., the temperature inside the camera and lens is the same and the intrinsic camera parameters remain unaffected by the changing temperature. Yu et al. [25] presented one of the most complete descriptions of the mathematical modelling describing the effect of temperature on the camera geometrical calibration.
The authors assumed a linear nature for the changes in camera parameters and used a linear-time invariant system to calculate the compensation model; moreover, they conducted 10 experiments. The experimental setup stand is not provided, but only its diagram in which an aluminium artifact is placed in front of the camera identifying 49 calibration feature points. The temperature change is carried out by changing the temperature in the whole laboratory by air conditioning; consequently, the calibration chart is also exposed to the temperature variations. From the charts in the paper, the range of temperature changes is about 8◦C. The compensation effects presented in the charts are significantly good. The authors also presented the effect of compensation on camera calibration during the camera warming-up process and on changes in ambient temperature. For the former and latter, the authors achieved a reduction in the drift by 95% and 65%, respectively. However, this method of compensation does not consider the influence of temperature on the distortion of the optical system. Moreover, this method is not applicable to any model other than the pinhole camera model. Elias et al. [24] estimated the temperature-related errors in low-cost cameras (Raspberry Pi camera and cameras in smartphones). Using a Monte-Carlo simulation, they revealed that for such cameras, the temperature-related errors can reach 10–20 mm at a distance of 10 m. They also determined that errors larger than 100 mm are less frequent, but still observable. The authors did not propose a compensation method but pointed that such a method can be developed to improve the camera calibration process.
The apparent issue common to all described compensation models is that their application is limited if the thermal image drift is randomised. Another crucial fact is that without modifications in a camera design, it is not possible to obtain a repeatable thermal image drift. This issue is clearly observed during the warming-up process and ambient temperature changes because the mechanical design of industrial-level cameras is not optimised for reducing thermal image drift. To this end, this study describes the possible cause behind the lack of repeatability in terms of thermal image drift and presents a novel, modified camera design that solves this problem and allows the application of a compensation model.
The rest of this paper is organised as follows. In section 2, the hardware experimental setup is described. In section 3, an outlook of typical industrial-level camera designs is presented while discussing the possible causes behind the lack of thermal image drift repeatability. The proposed modified camera design that eliminates the aforementioned problem is presented in section 4. The results of the modifications and application of the compensation model are presented in section 5. The last section 6 contains the conclusions and discusses possible directions for further development.
The effect of temperature on cameras is usually determined by extracting features from captured images during camera operation under various environmental conditions. The image artifact with features is positioned in the field of view (FOV) of the camera, and the characteristic points are tracked. The thermal image drift is then determined depending on the calculated trajectories of the markers at various temperatures. The experimental setup that allows such measurements should ensure:
In this study, a dedicated experimental setup is designed and developed consisting of a modified thermal chamber, frame made from invar, and image artifact. The designed setup is stored in a laboratory equipped with air conditioning (temperature stabilisation of ±1◦C). The modified thermal chamber isolates temperature changes only on the camera tested, and the artifact is stored outside the thermal chamber. The camera and artifact are fixed to the rigid invar frame, which ensures unchanged mutual positions in a wide range of environment temperatures inside the thermal chamber. The thermal chamber is equipped with an automated flap that can cover the inspection hole used for the camera FOV. When it is open, there are no obstacles between the camera and the image artifact. The developed laboratory stage is presented in Fig. 5 and 6.
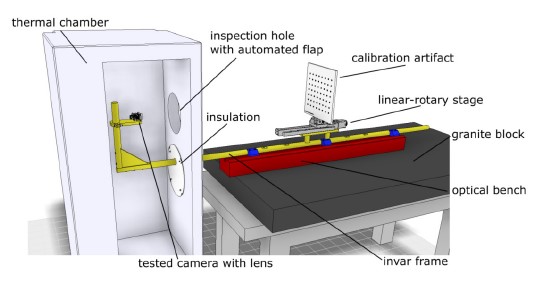
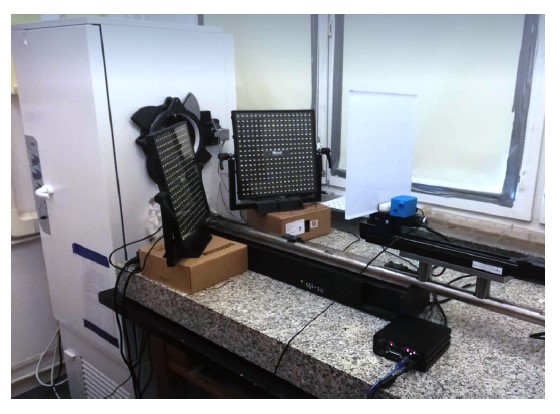
The used thermal chamber allows temperature changes in the range of −10◦C to 70◦C; moreover, it is equipped with a communication interface and can be controlled using MATLAB software. The inspection flap for the camera FOV can be controlled remotely from MATLAB, as well. The test stand is equipped with four temperature sensors that can be applied to any surface and are also connected to MATLAB. For uniform scene lighting, two Akurat S8Mark2 LED panels [40] are used. This setup conducts fully automated measurement over a long period of time with different temperature and time profile scenarios.
The image artifact is made from a 10 mm glass plate and is mounted to the linear-rotary table. On one side of the glass, there is a matrix of 8 × 7 black, rounded markers on a white matt plane. The diameter of each marker is 8 mm, and the nominal spacing is 30 mm. The artifact is initially validated on a coordinate measurement machine equipped with a Carl Zeiss Viscan Optical Header for determining precise coordinates of the centre of every marker.
The designed test stand conducts predefined experiments that can last up to several dozen hours or days. The camera, thermal chamber, temperature sensors, and linear-rotary stage are connected to one PC and can be controlled using MATLAB software. The biggest advantage of the described solution is that temperature variations are limited to the investigated camera only, as the calibration artifact is placed outside the thermal chamber. When the inspection flap is left open, there are no obstacles between the camera and the image artifact.
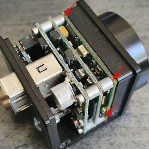
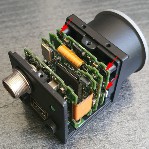
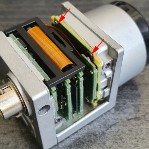
A majority of commonly available industrial-level cameras are designed significantly in a similar way. In their design, one can distinguish a set of printed circuit boards (PCBs), often stacked into a sandwich composition. A PCB with a sensor is located on top of the stack and fixed to a metal block equipped with a c-mount lens socket. All the interfaces (such as, GigE, Firewire, USB, and CoaxExpress) are usually located at the back side of the camera. The camera housing is often built from metal sheets, bent to desired shape (either aluminium or steel). The small differences in a mechanical design of each camera model, provided by different manufacturers, are concerned with dimensions, detailed housing solutions, colours, surface finishes, and integration of electronic PCBs. The one thing similar for the majority of designs is the way in which the PCB with sensor is connected to a metal block with c-mount lens socket. The PCB with sensor is generally screwed to the metal block with several (usually four) small bolts. In Fig. 7, typical industrial-level cameras are presented with a removed casing. All photos show the bolted connection between the PCB with sensor and the c-mount metal block.
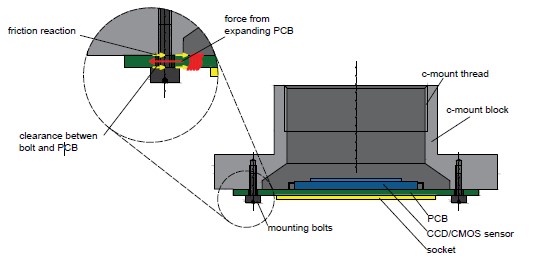
This structural connection over-constrains the PCB with sensor leaving no thermal degrees of freedom. This insight may impact the lack of repeatability observed in a thermal image drift as this screwed connection is prone to mechanical hysteresis under thermal deformation [41]. The nature of this phenomenon is explained in Fig. 8. The PCB with the sensor is fixed to the c-mount block with a set of four (only two are visible) screws. There is a small clearance between the hole in the PCB and the bolt. When the sensor starts deforming (due to temperature changes caused by the warming-up process or changing ambient temperature), it cannot deform freely; therefore, internal stresses are observed in the PCB. When the internal forces are higher than the friction reaction forces introduced by the pre-loading forces from bolts, the PCB with sensor shifts in relation to the c-mount block and lens. The apparent result is the thermal image drift observed on the captured frames. Naturally,this phenomenon is not repeatable and random. Moreover, the sensor cannot be expected to return to its initial place when the temperature returns to its initial value.
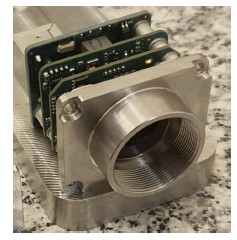
Next, an experiment is set up to confirm this hypothesis using the test stand described in section 2 and an IDS UI-5282SE Rev 4 camera [42] equipped with the Fujinon 25 mm lens (Fig. 9). This camera model has no housing and is equipped only with the c-mount block manufactured from aluminium. The camera is fixed to an invar frame in a thermal chamber using two taper screws, ensuring a stable connection that is not prone to mechanical hysteresis. The temperature inside the thermal chamber (called the reference temperature) is set to 24◦C. Before the acquisition starts, the camera is turned on and left for at least 2 h to warm up. The thermal chamber inspection flap is left open, and the camera captures images continuously, one frame per 30 s. The temperature profile registered during this experiment is presented in Fig. 10.
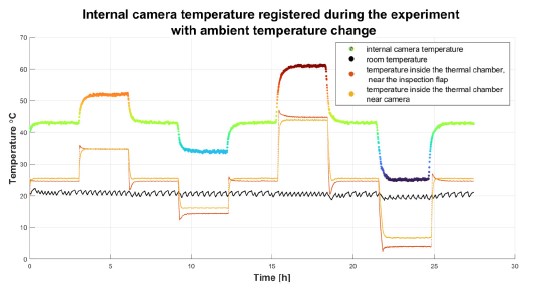
The temperature inside the thermal chamber is changed eight times, and each stabilised temperature lasts for 3 h. The temperature profile is defined in such a way that it reaches the reference temperature five times. The temperature registered by the internal camera sensor is marked with a coloured line with different colours denoting different temperatures, and this notation is consistent with other figures (Fig. 11 and 12). The temperature of the camera is always approximately ≈ 19◦C higher than the ambient temperature. Additionally, the delay between the camera and ambient temperatures is negligibly small due to the fact that there is no camera housing and the thermal camera response is significantly fast.
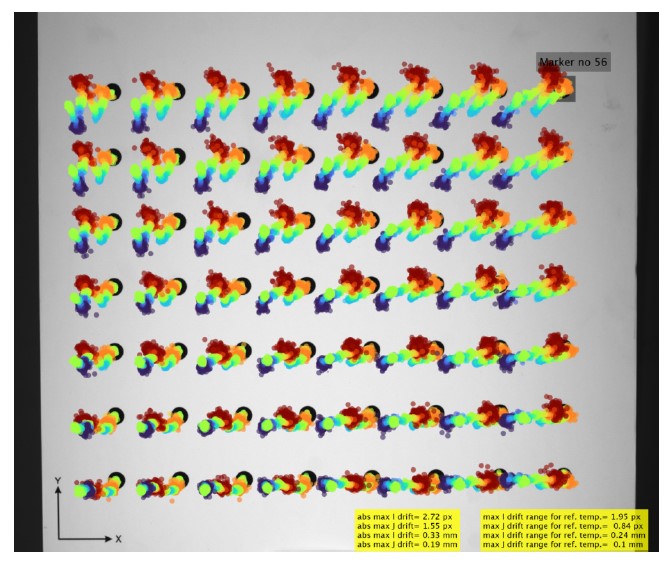
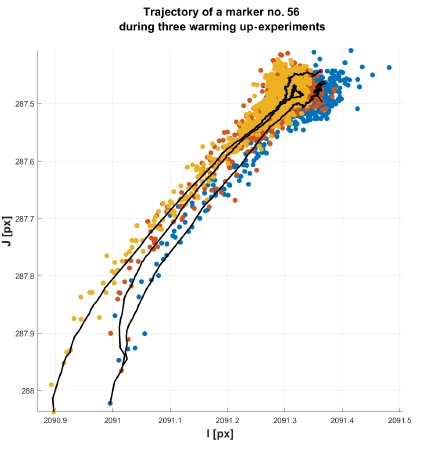
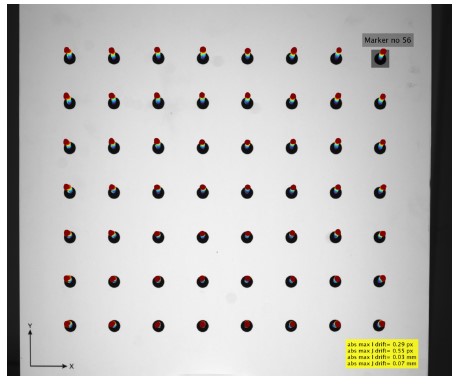
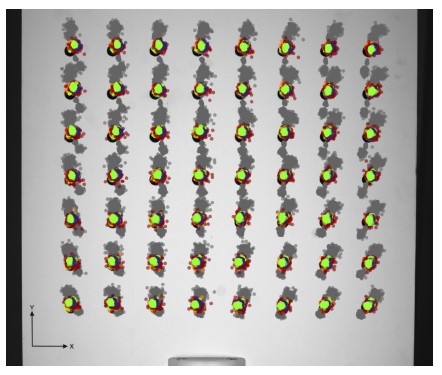
The thermal image drift (scaled ×100) registered during this experiment is presented in Fig. 11. Note that despite the camera temperature reaching the reference temperature five times (24◦C in the thermal chamber and 43◦C in the camera), the centres of markers are always in different locations. To evaluate this issue quantitatively, the range of the thermal image drift with respect to the reference temperature is calculated separately for horizontal (I) and vertical (J) coordinates. The range of the thermal image drift with respect to the reference temperatures for all markers is 1.95 px (0.24 mm) and 0.84 px (0.10 mm) for horizontal and vertical drifts, respectively. For this particular camera unit, the lack of repeatability aspect is much stronger for horizontal coordinates than that for vertical coordinates.
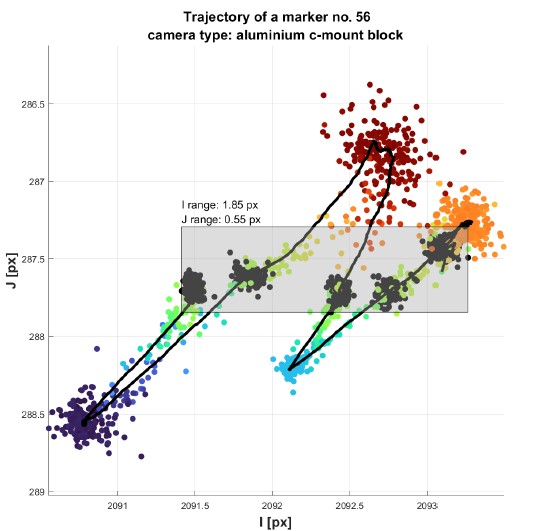
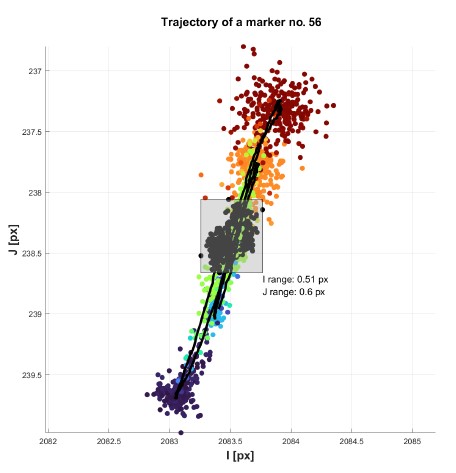
A single marker (no. 56) trajectory is presented in magnitude terms in Fig. 12. The centres of the markers captured for the reference temperatures are black, and the grey rectangle indicates the ranges of the thermal image drift with respect to the reference temperatures for this particular marker. The averaged marker trajectory is marked with the black line.
The results presented in FFig. 11 and 12 confirm that the thermal image drift is not repeatable. The PCB with image sensor is rigidly bolted to the c-mount housing causing the over-constrained connection prone to the mechanical hysteresis. To solve the problem, a novel PCB mounting is proposed that maintains planar degrees of freedom and allows unconstrained deformation.
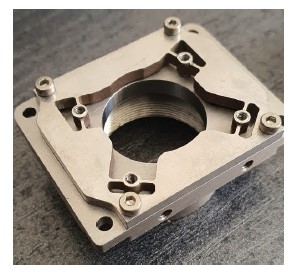
The same camera model (IDS UI-5282SE Rev 4 camera) [42] is used and the original c-mount block is replaced with the redesigned one. The designed c-mount block comprises two separate parts: the main body with the c-mount thread and the plate for the PCB, equipped with specialised flexures that maintain planar thermal degrees of freedom of the PCB. To additionally decrease the thermal image drift, the authors decided to manufacture the parts from invar usingEDMwire cutting. The PCB with sensor is screwed to the threaded holes in the middle of each flexure. The geometry of the flexure was simulated using finite elements method (FEM) and optimised to allow the the PCB to deform freely in both horizontal and vertical directions. The plate with flexures is presented in Fig. 13 and 14. The black arrows in Fig. 13 show the directions in which flexure deformation is the easiest.
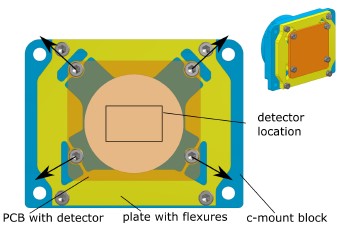
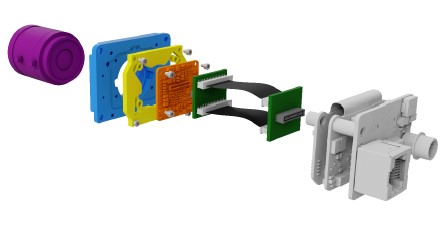
Additionally, the sandwich composition of the camera PCBs is modified. The camera is equipped with an elastic ribbon and the other PCBs are mechanically separated from the PCB with sensor such that the effect of the possible thermal deformations on the image drift is limited to only the PCB with sensor. The modified camera design is presented in FFig. 15.
The modified camera is investigated in the test stand described in section 2. The first experiment is the warming-up session repeated three times. In these experiments, the thermal chamber is turned off. The only source of heat is the camera. The camera is mounted on an invar frame and, immediately after initialisation, continuously captures frames of the image artifact at a speed of 1 frame per second (FPS). Each warming-up experiment lasts 2 h. After the camera reaches its constant temperature, it is turned off and left to cool down. After 2 h, it is turned on again, and thewarmingup experiment is repeated. This loop is repeated three times. In Fig. 16, 17 and 18, 19, a comparison of the results of this experiment is presented, i.e., between the modified camera design (Fig. 18 and 19) and the original camera design (Fig. 16 and 17 that use an aluminium c-mount block and over-constrained PCB with sensor). The repeatability of thermal image drift is significantly high in both cases, but the absolute maximum drift decreases twice. This reduction is probably caused by the fact that the modified camera c-mount block is manufactured from invar.
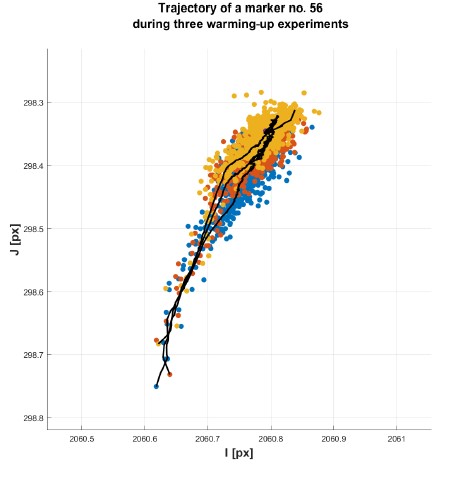
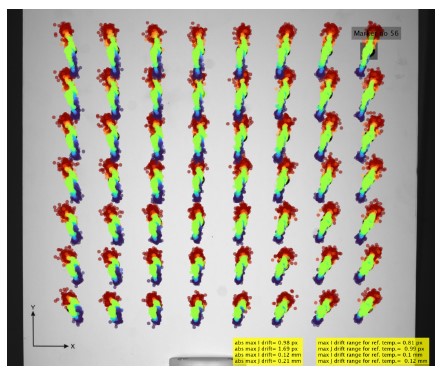
The real advantages of the introduced modifications are visible in the results of the experiment with the ambient temperature changes. The modified camera design is tested under the same scenario as described in section 3. The defined temperature profile is the same as presented in Fig. 10. Fig. 20 and 21 present the results of this experiment. The improvement is clearly evident as the marker trajectories are significantly more repeatable for the modified design (compared to the original camera design, the thermal image drift of which is presented in Fig. 11 and 12). Additionally, note that the thermal image drift in the horizontal direction is significantly small. Single marker trajectory (Fig. 21) is close to linear. The maximum drift range for the reference temperature is equal to 0.99 px (0.12 mm) vertically and 0.81 px (0.1 mm) horizontally. This experiment is repeated several times, and the centres of markers follow the same trajectories each time.
The introduced camera design modifications, which allow the PCB with sensor to deform freely, cause the thermal image drift to be more repeatable and allow a compensation model to be fitted. Herein, the polynomial compensation model is fitted, as introduced in Ref. 31. This compensation method performs adequately for the thermodynamically stable states of the camera. Another experiment is conducted in which the image acquisition is processed only when the camera temperature is stabilised. The temperature profile is similar to the one presented in Fig. 10. The best fitting results are observed for the three-degree polynomial. Fig. 22 shows the results of applying the compensation model to a series of frames that are captured over a range of temperature values from 5◦C to 45◦C. The thermal image drift after compensation is focused on a much smaller area near the initial coordinates of markers (in comparison to Fig. 20).
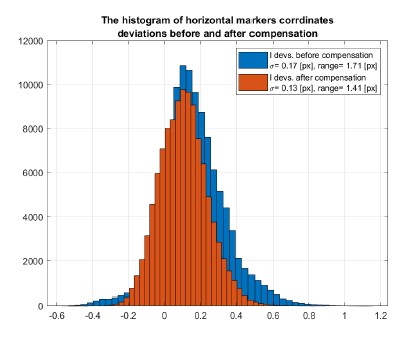
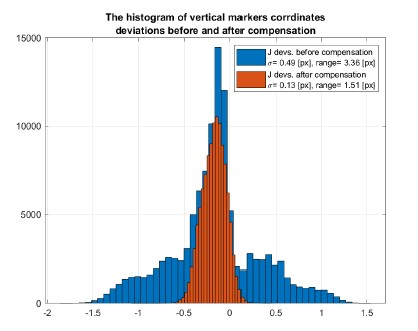
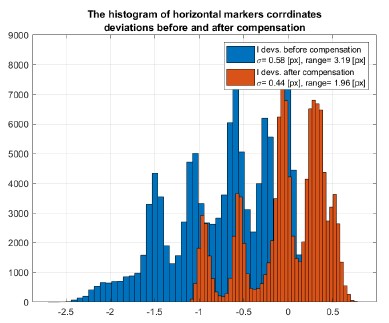
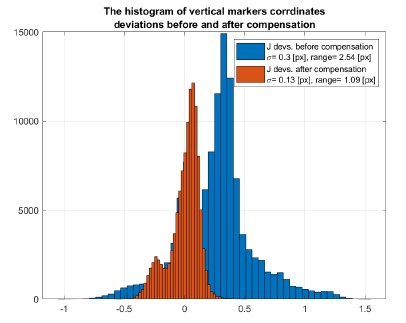
The histogram of the deviations in the vertical and horizontal coordinates for the centres ofmarkers before and after compensation is presented in Fig. 23(a) and (b). The biggest improvement is observed for the vertical thermal image drift, as the range is reduced from 3.36 px to 1.51 px. The horizontal drift range is reduced from 1.71 px to 1.41 px. The lower reduction in the horizontal drift is related to the low value of the initial drift in this direction. The compensation reduces the standard deviation of the central shifts of the image drift (calculated as the root of the sum of squares of the standard deviations in each direction) by ×3.99, and the absolute range of the image drift is reduced by ×2.53.
The same compensation method is used to fit and compensate the data captured for the original camera (with overconstrained PCB), as presented in Fig. 11 and 12. The results are presented in Fig. 24 and 25). The applied model improves the results in the vertical direction (J coordinate) as the thermal image drift in this direction is much more repeatable. The results for the horizontal direction (I coordinates) also show the reduced drift, but the obvious lack of repeatability does not allow the model to fully compensate drift. The thermal image drift is not focused on the initial coordination of markers.
This paper introduces novel industrial-level camera modifications that allow the PCB with sensor to deform freely. This modification improves the repeatability aspect of a thermal image drift observed in the cameras exposed to varying ambient temperatures. The experimental results confirm that the thermal image drift is much more repeatable after the modification, allowing the application of the compensation model. This compensation then reduces the standard deviation of the central shifts of the image drift (calculated as the root of the sum of squares of the standard deviations in each direction) by ×3.99 and the absolute range of the image drift is reduced by ×2.53.
The proposed camera modification should be accessible in terms of implementation for most of the current industriallevel cameras. The stiffness of the flexures, their shape, and orientation with respect to the sensor should be similarly adjusted to the proposed camera design for optimisation. Another optimisation can be made with regard to the material. Herein, a modified c-mount block from invar is manufactured, but other (cheaper) materials should also provide similar improved results.
For future work, this research into the effect of temperature on industrial-level cameras will continue. Moreover, the current compensation model is planned to be extended for compensating the thermal image drift in thermodynamically unstable states. Lastly, the thermal sensor deformations in the current camera calibration algorithms are planned to be incorporated, as the current pinhole camera calibration does not consider the fact that the sensor deforms during the warming-up process and when the camera is exposed to ambient temperature changes.
The authors declare that they have no conflict of interest.
M.A.: conceptualisation, methodology, software, validation, resources, data curation, writing, visualisation, project administration, founding acquisition. K.N.: software, data curation.
This research was funded by CB POB FOTECH of Warsaw University of Technology within the Excellence Initiative: Research University (IDUB) program.
Coffey, V. C. Machine vision: The eyes of in- dustry 4.0. Opt. Photon. News 29, 42–49 (2018). https://doi.org/10.1364/OPN.29.7.000042
Szeliski, R. Computer Vision: Algorithms and Applications 2nd Edition (Springer, 2021).
Emmer, C., Glaesner, K.-H., Pfouga, A. & Stjepandić,J. Advances in 3d measurement data management for industry 4.0. Procedia Manuf. 11, 1335–1342 (2017). https://doi.org/10.1016/j.promfg.2017.07.262
Machine vision market. Accessed: 2021-09-26. https://www.marketsandmarkets.com/Market-Reports/industrial-machine-vision-market-234246734.html
Lenty, B., Sioma, A. & Kwiek, P. Quality control au- tomation of electric cables using machine vision. In Romaniuk, R. S. & Linczuk, M. (eds.) Photonics Ap- plications in Astronomy, Communications, Industry, and High-Energy Physics Experiments 2018, 129 (SPIE, 2018). https://doi.org/10.1117/12.2501562
Davies, E. 4-machine vision in the food industry. In Caldwell, D. G. (ed.) Robotics and Automation in the Food Industry->, 75–110 (Woodhead Publishing, 2013). https://doi.org/10.1533/9780857095763.1.75
Siekański, P. et al. On-line laser triangulation scanner for wood logs surface geometry measurement. Sensors (Switzer- land) 19, 1074 (2019). https://doi.org/10.3390/s19051074
Peisheng, T., Ronggui, D. & Yubin, Z. A stereoscopic ware- house stocktaking method based on machine vision. In J. Phys.-Conference Series, 1627 (IOP Publishing Ltd, 2020). https://doi.org/10.1088/1742-6596/1627/1/012015
Michoński, J., Glinkowski, W., Witkowski, M. & Sitnik, R. Automatic recognition of surface landmarks of anatomical structures of back and posture. J. Biomed. Opt. 17, 056015 (2012). https://doi.org/10.1117/1.JBO.17.5.056015
Glinkowski, W. M. et al. Posture and low back pain during pregnancy—3d study. Ginekol. Polska 87, 575–580 (2016). https://doi.org/10.5603/GP.2016.0047
Galata, D. L. et al. Applications of machine vision in phar- maceutical technology: A review. Eur. J. Pharm. Sci. 159, 105717 (2021). https://doi.org/10.1016/j.ejps.2021.105717
Karaszewski, M., Adamczyk, M. & Sitnik, R. As- sessment of next-best-view algorithms performance with various 3d scanners and manipulator. ISPRS J. Photogramm. Remote Sens. 119, 320–333 (2016). https://doi.org/10.1016/j.isprsjprs.2016.06.015
Karaszewski, M., Lech, K., Bunsch, E. & Sitnik, R. In the pursuit of perfect 3d digitization of surfaces of paintings: Geometry and color optimization. In Ioannides, M. et al. (eds.) Digital Heritage. Progress in Cultural Heritage: Doc- umentation, Preservation, and Protection, 25–34 (Springer International Publishing, 2014).
Wang, S., Liang, J., Li, X., Su, F. & Zhao, Z. A cali- bration method on 3d measurement based on structured- light with single camera. In Nomura, T., Liu, J., Jia, B., Yao, X. & Wang, Y. (eds.) 2019 International Conference on Optical Instruments and Technology: Optical Systems and Modern Optoelectronic Instruments, 109 (SPIE, 2020). https://doi.org/10.1117/12.2550235
Liberadzki, P., Adamczyk, M., Witkowski, M. & Sitnik,R. Structured-light-based system for shape measurement of the human body in motion. Sensors 18, 2827 (2018). https://doi.org/10.3390/s18092827
Lenar, J. et al. Lower body kinematics evaluation based on a multidirectional four-dimensional structured light measurement. J. Biomed. Opt. 18, 056014 (2013). https://doi.org/10.1117/1.jbo.18.5.056014
Zou, H., Cao, K. & Jiang, C. Spatio-temporal visual anal- ysis for urban traffic characters based on video surveil- lance camera data. ISPRS Int. J. Geo-Inf. 10, 177 (2021). https://doi.org/10.3390/ijgi10030177
Stylios, I., Kokolakis, S., Thanou, O. & Chatzis, S. Be- havioral biometrics and continuous user authentication on mobile devices: A survey. Inf. Fusion 66, 76–99 (2021). https://doi.org/10.1016/j.inffus.2020.08.021
Adamczyk, M., Sieniło, M., Sitnik, R. & Woźniak, A. Hier- archical, three-dimensional measurement system for crime scene scanning. J. Forensic Sci. 62, 889–899 (2017). https://doi.org/10.1111/1556-4029.13382
Sitnik, R. New method of structure light measurement system calibration based on adaptive and effective evaluation of 3d- phase distribution. In Proc. SPIE, Optical Measurement Systems for Industrial Inspection IV, vol. 5856, 109–117 (2005).https://doi.org/10.1117/12.613017
Chen, R. et al. Accurate calibration method for camera and projector in fringe patterns measure- ment system. Appl. Opt. 55, 4293–4300 (2016). https://doi.org/10.1364/AO.55.004293
Sładek, J., Sitnik, R., Kupiec, M. & Błaszczyk, P. The hybrid coordinate measurement system as a response to industrial requirements. Metrol. Meas. Syst. XVII, 537–547 (2010). https://doi.org/10.2478/v10178-012-0001-3.Brought
Zhang, Z. A flexible new technique for camera calibra- tion. IEEE Trans. Pattern Anal. Mach. Intell. 22, 1330–1334 (2000). https://doi.org/10.1109/34.888718
Elias, M., Eltner, A., Liebold, F. & Maas, H. G. Assessing the influence of temperature changes on the geometric stability of smartphone-and raspberry Pi cameras. Sensors (Switzerland) 20, 643 (2020). https://doi.org/10.3390/s20030643
Yu, Q. et al. The effects of temperature varia- tion on videometric measurement and a compensation method. Image Vis. Comput. 32, 1021–1029 (2014). https://doi.org/10.1016/j.imavis.2014.08.011
Handel, H. Compensation of thermal errors in vi- sion based measurement systems using a system iden- tification approach. In 2008 9th International Confer- ence on Signal Processing, 1329–1333 (IEEE, 2008). https://doi.org/10.1109/ICOSP.2008.4697377
Handel, H. Analyzing the influences of camera warm-up on image acquisition. IPSJ Trans. Comput. Vis. Appl. 1, 12–20 (2009). https://doi.org/10.1109/ICOSP.2008.4697377
Podbreznik, P. & Potočnik, B. Assessing the influence of temperature variations on the geometrical properties of a low-cost calibrated camera system by using computer vi- sion procedures. Mach. Vis. Appl. 23, 953–966 (2012). https://doi.org/10.1007/s00138-011-0330-3
Pan, B., Shi, W. & Lubineau, G. Effect of cam- era temperature variations on stereo-digital image correla- tion measurements. Appl. Opt. 54, 10089–10095 (2015). https://doi.org/10.1364/AO.54.010089
Adamczyk, M., Kamiński, M., Sitnik, R., Bogdan, A. & Karaszewski, M. Effect of temperature on calibration quality of structured-light three-dimensional scanners. Appl. Opt. 53, 5154 (2014).https://doi.org/10.1364/AO.53.005154
Adamczyk, M., Liberadzki, P. & Sitnik, R. Tempera- ture compensation method for digital cameras in 2D and 3D measurement applications. Sensors 18, 1–17 (2018). https://doi.org/10.3390/s18113685
UI-6280SE-C-HQ Rev.3. https://en.ids-imaging.com/download-details/AB.0010.1.54800.24.html Accessed: 2021-09-26.
Factory Automation/Machine Vision-Fixed Focal. https://www.fujifilm.com/us/en/business/optical-devices/machine-vision-lens/hf-ha-1s-series Accessed: 2021-09-26.
Sitnik, R., Kujawinska, M. & Woznicki, J. M. Dig- ital fringe projection system for large-volume 360-deg shape measurement. Opt. Eng. 41, 443–449 (2002). https://doi.org/10.1117/1.1430422
Sitnik, R. & Kujawińska, M. From cloud-of-point coordinates to three-dimensional virtual environment: the data conversion system. Opt. Eng. 41 (2002). https://doi.org/10.1117/1.1430419
Yoder, P. Opto-Mechanical Systems Design (CRC Press, 2005).
Vukobratovich, D. & Yoder, P. Fundamentals of Optome- chanics (CRC Press, 2018).
Noda, T. Temperature compensation with DOE for zoom lens. In Proc. SPIE, 11106, 111060 (2019). https://doi.org10.1117/12.2527944
Thermoelectric Cooled Camera - VP Series|Area Scan Camera| Vieworks. http://www.vieworks.com/eng/product.html?pid=32 Accessed: 2021-09-26.
Akurat Lighting - S8 MARK2. https://www.akurat.lighting/en/products/soft-panels/s8-mark-2-strong-lenticular-130w-led-panel Accessed: 2022-01-03.
Lake, M. S. & Hachkowski, M. R. Design of Mech- anisms for Deployable, Optical Instruments: Guidelines for Reducing Hysteresis. In NTRS - NASA Technical Re- ports Server, 20000032952 (2000). https://ntrs.nasa.gov/api/citations/20000032952/downloads/20000032952.pdf
UI-5282SE-C Rev.4. https://en.ids-imaging.com/store/ui-5282se-rev-4.html Accessed: 2022-01-07.