
Novel transient-state analysis approach for distributed temperature sensing based on spontaneous Raman scattering
- Institute of Electronics, Lodz University of Technology, al. Politechniki 10, 93-590 Lodz, Poland
Article Info
Received 02 Jan. 2024
Received in revised form 21 Mar. 2024
Accepted 05 Apr. 2024
Available on-line 24 May 2024
Keywords: Optical fibre; Raman scattering; distributed temperature sensing; OTDR; OFDR.
Abstract
The light scattering phenomenon in optical fibres has been implemented in several applications for years. Nowadays, commercial distributed sensing systems for temperature measurements – distributed temperature sensing (DTS) – are gaining more attention and are being applied in many fields. The DTS systems are commonly based on optical time domain reflectometry or optical frequency domain reflectometry analysis approaches. This paper presents the simulation model and primary experimental results of a novel approach for data analysis for DTS systems based on the measurement of the backscattered Raman anti-Stokes radiation: the optical transient-state domain reflectometry. The novelty of this approach is the fast and accurate proposed analysis algorithm, as well as the cost-effective, secure and reliable set-up, whose main aspect is the implementation of long, low-power input laser pulses.
Introduction
The backscattered light spectrum provides crucial information regarding the physical state of an optical fibre and its surrounding environment. The light scattering phenomenon in optical fibres has been implemented in several applications over the years: in medicine [1, 2], chemistry [3, 4], geothermal systems [5], aeronautical applications [6], and remote sensing in the oil and gas industry [7], power cables [8, 9], hydrology [10, 11], and atmospheric applications [12]. The light scattering in optical fibres allows the measurement of several physical quantities, such as strain [13], humidity [14], and temperature [15] over the entire length of an optical fibre. The optical fibres are immune to electromagnetic interferences, durable, and are more available nowadays, hence, distributed optical fibre sensor (DOFS) systems are popular in several applications [3].
Elastic light scattering occurs when there is no loss of energy and photons do not change their wavelength, whereas the inelastic light scattering occurs when there is an interaction that causes loss or gain of energy, and the scattered photons have a longer or shorter wavelength [16]. The strongest band in the backscattered spectrum is the elastic Rayleigh scattering band which has the same wavelength as the incident light wavelength. The Rayleigh scattering is enhanced by the irregularity of the molecular structure [17]. The inelastic Brillouin scattering and Raman scattering bands have higher (Stokes) or lower (anti-Stokes) wavelength than the incident light. The Brillouin scattering is caused by the lattice vibrations, while the Raman scattering is caused by the temperature-dependent molecular and atomic vibrations [9].
The DOFS systems based on the Rayleigh scattering exploit the propagation effects, including attenuation and gain, phase interference, and polarization variation, to achieve measurements of magnetic fields and ionizing radiations [18], relative humidity [19], and chemicals concentration [20]. The implementation of optical fibres within power cables allows the monitoring of power cables and an easy localization of defects over the years [8, 17]. In contrast, DOFS systems for strain measurement are based on the measurement of the Brillouin scattering, in which frequency and intensity are dependent on fibre density which is enhanced by optical fibre deformation as a result of the applied strain [21]. Such systems can provide the valuable information regarding the health of structures, such as buildings [22], bridges [23], and railways infra-structure [24]. The frequency of the Brillouin scattering depends also slightly on temperature. However, it is hard to separate the Brillouin band from the strong, adjacent Rayleigh band. Hence, for temperature measurements, the spontaneous Raman anti-Stokes backscattered radiation is observed since its intensity is highly dependent on temperature [25].
Distributed temperature sensing (DTS) systems measure the temperature along the optical fibre. This means the ability to obtain the temperature profile for lengths up to tens of km, while having the receiver at the transmitting base [26]. The laser power, the laser wavelength, and the fibre type are the key parameters of each DTS system. The choice of these parameters depends on the application, the desired spatial range (dynamic resolution), and the spatial resolution [17, 27] of the DTS system. The optical fibre attenuation is different for each type of optical fibres, and also depends on the laser wavelength. The fibre attenuation should be small to retain the energy of the laser light for the longest possible distance [9]. Single-mode optical fibres and graded-index multimode optical fibres, along with high-wavelength lasers (e.g., 1550 nm) are suitable for the long distance applications [27].
Several demodulation algorithms have been presented in order to improve the sensitivity and the correctness of the results [28, 29]. One of the most popular methods is the calculation of the ratio of the Raman anti-Stokes to the Raman Stokes intensities, which eliminates the fibre link losses [29]. DTS systems have been applying the analysis in the optical time domain reflectometry (OTDR) [30, 31] or in the optical frequency domain reflectometry (OFDR) [27, 32].
Optical time domain reflectometry (OTDR)
OTDR is the most popular analysis method in DTS systems, due to its simplicity and accuracy. The main principle of the OTDR method is a measurement of the backscattered radiation of powerful, short laser pulses of the order of 10 ns or less [7] that are launched into the optical fibre periodically in a time interval enough to achieve the specific spatial resolution [17]. The spatial resolution can be determined by (1)
\( \Delta z_{\min }=\frac{c \tau}{2 n} \) (1)
where 𝑐 is the velocity of light in vacuum, 𝜏 is the laser pulse duration, and 𝑛𝑛 is the refractive index of the optical fibre. In order to achieve a 1 m spatial resolution, the laser pulse duration should be:
\( \tau=\frac{2 \Delta z_{\min } n}{c}=10 \mathrm{~ns} \) (2)
A huge amount of laser light pulses is required in order to eliminate the noise and achieve the respectful temperature resolution, thus the registrations could be time-consuming [7]. The backscattered radiation is collected and detected by a photodiode (PIN, Avalanche) with high sensitivity, then averaged and filtered in order to reduce the noise effect. The OTDR analysis algorithm calculates the temperature from the amplitude of the detected signal, while the location is determined by the calculation of time at which the peak amplitude appears. The spatial range of a DTS system, based on the OTDR analysis is [17]:
\( L_{\max }=\frac{c T}{2 n} \) (3)
where 𝑇 is the laser pulse period.
Optical frequency domain reflectometry (OFDR)
Depending on the light source type, the OFDR can be categorised into a coherent OFDR in which the frequency of a coherent light source is modulated by a tunable laser source (TLS) [33] or incoherent OFDR, where the laser light intensity is sinusoidally modulated by an electrooptic modulator (EOM) [32, 33] and different modulation frequencies are set one after another in series. The modulated input laser light, the backscattered Raman Stokes, and the backscattered Raman anti-Stokes are detected for each frequency by the photodiodes. The spatial resolution can be obtained by [27]
\( \Delta z_{\min }=\frac{c}{2 n f_{\max }} \) (4)
where 𝑓max is the maximum modulation frequency. The amplitude and phase of the modulated input laser light are weakly dependent on the modulation frequency, while the amplitude and phase of the detected Raman Stokes and Raman anti-Stokes signals are dependent on the modulation frequency [27]. The collected signals are fed to a vector network analyser (VNA) in order to convert them into a digital form and calculate discrete, complex modulation transfer functions for the Raman Stokes and Raman anti-Stokes signals. Finally, the discrete inverse fast Fourier transform (IFFT) is calculated for transfer functions and the result is presented as a pulse response [32]. In the OFDR analysis algorithm, the amplitude of a detected signal is used to calculate the temperature value, while the phase presents the hotspot location. The spatial range of a DTS system, based on the OFDR analysis is [27]:
\( L_{\max }=\frac{c}{2 n \Delta f} \) (5)
where Δ𝑓 is the step of the modulation frequency.
OTDR and OFDR capabilities and drawbacks
DTS systems are commercially available for different industrial applications and are developed and updated to enhance their capabilities and expand their applications. Depending on the desired spatial range and spatial resolution, the parameters of the DTS system can be chosen. Table 1 presents some examples of the parameters of DTS systems based on the OTDR and OFDR approaches.
Table 1.
The parameters of DTS systems based on OTDR and OFDR approaches.
OTDR-based DTS systems |
|||||
Ref. |
Input laser power |
Input pulse duration |
Spatial range |
Spatial resolution |
Temp. resolution |
70 W |
2.6 ns |
3 km |
0.5 m |
0.6 °C |
|
50 W |
10 ns |
26 km |
1 m |
3 °C |
|
70 mW |
10 ns |
3 km |
1 m |
1 °C |
|
0.15 mW |
200 ps |
200 m |
0.1 m |
2 °C |
|
OFDR-based DTS systems |
|||||
Ref. |
Input laser power |
Maximum modulation frequency |
Spatial range |
Spatial resolution |
Temp. resolution |
320 mW |
25 MHz |
16 km |
2 m |
2 °C |
|
80 mW |
67 MHz |
4 km |
1.5 m |
3 °C |
|
100 mW |
10 MHz |
30 m |
0.96 m |
0.9 °C |
|
Although the DTS systems measurements based on the above-mentioned methods are accurate, the DTS systems components, such as high-power lasers, TLS, EOM, and VNA, are relatively expensive. In order to enhance the signal-to-noise ratio (SNR) and reduce link losses and to achieve a desired temperature resolution and spatial resolution, both methods apply statistical averaging and time-consuming demodulation algorithms which may extend the measurement time up to several minutes [40].
Moreover, OTDR-based systems may suffer from dead measurement zones which occur as a result of reflection or attenuation. The power of these events can be several orders of magnitude higher than the power of the backscattered signals, leading the receiver to saturation. The receiver needs time to retain its stability, and by that time, the system is unable to perform temperature measurements correctly. Dead zones can be eliminated by the implementation of the fast single-photon detectors and the generation of very short laser pulses, even at picosecond levels of value [41]. However, this may reduce the system dynamic range and the SNR. The solution requires the implementation of a low-pass filter which involves compli-cation and higher cost of the system [42].
Coherent OFDR-based systems are limited to short measurement lengths. At longer distances, while approach-ing the laser coherence length, the phase noise of the TLS source increases and as a result the SNR decreases [33, 43]. This can be solved by the short tuning range of the TLS [44] or the implementation of the laser phase noise compensation [45], yet again, this solution is expensive and complicates the system set-up.
Optical transient-state domain reflectometry concept
In contrast to the OTDR method, the novel optical transient-state domain reflectometry (OTsDR) approach relies on the measurement of the backscattered light during a long laser pulse, whose duration can be of the order of microseconds. The pulse duration is determined by the length of the tested optical fibre. The OTsDR approach measures the backscattered signals at each discrete point, determined by the spatial resolution of the system, which depends on the sampling rate of the analogue-to-digital converter (ADC). The backscattered signals are summed for all the measured points from the beginning to the end of the optical fibre. Hence, the registered backscattered signals are integrated and the temperature profile can be easily reconstructed by applying the derivative calculation.
The proposed OTsDR approach does not require a high optical power of the laser diode as needed in the OTDR analysis method, which requires an optical power in the range of 1–70 W [17, 34, 46]. In contrast to the OFDR method, the long laser pulses are obtained through the electrical binary modulation of the laser diode for a constant frequency, not by an EOM. The OTsDR approach can be applied to the DTS systems in which the optical power of the laser diode might be several orders of magnitude lower than the optical power in commercial DTS systems (Table 1). Beside their safeness, low-power laser diodes are much cheaper than the currently used laser diodes in commercial DTS systems. Also, to generate long laser pulses, a very simple laser diode control unit is needed. Due to the simple construction of the DTS system based on the OTsDR approach, the system is cost-effective and can be more reliable. Moreover, the implementation of a low-power laser diode expands the DTS systems applicability in more environments. Due to the simple calculation algorithm, the OTsDR approach is capable of providing the temperature profile along the optical fibre in a time comparable to the conventional methods.
For the purpose of obtaining the temperature profile along the optical fibre using the OTsDR approach, the Bose-Einstein probability distribution of phonons for the anti-Stokes lines (𝜌𝐴s) is calculated through the proposed demodulation algorithms calculations in the time domain. Having the Bose-Einstein probability distribution of photons calculated at the length z of the optical fibre, the temperature profile T(z) can be estimated, since [27]:
\( \rho_{A S}(z)=\frac{e^{\frac{-\Delta E}{k T(z)}}}{1-e^{\frac{-\Delta E}{k T(z)}}} \) (6)
\( \Delta E=h \Delta v \) (7)
where 𝛥v is the Raman anti-Stokes frequency shift, ℎ is the Planck constant, and 𝑘 is the Boltzmann constant. In order to present the idea of the OTsDR approach, one may refer to Fig. 1 which presents a hotspot of the length 𝑑z , at the distance 𝑧 along the optical fibre.
Assuming that the power of the input laser is 𝑃𝑖n (𝑡)=𝑃01(𝑡), the power of the scattered light at the point 𝑧 can be obtained from (8), for 𝑧∈(0, 𝐿).
\( P(z)=P_0 e^{-a_0 z} \) (8)
where 𝑃0 is the optical power of the laser diode, 𝛼0 is the power attenuation of the optical fibre for the input laser wavelength and 𝑧 is the distance of the scattering point. The power of the backscattered light, detected at the beginning of the optical fibre, for 𝑧∈(0, 𝐿), is expressed by (9)
\( d P_{\text {out }, A S}(z, T)=P_0 \Gamma_{A S} \rho_{A S}(T) e^{-\alpha_{A S} z} d z \) (9)
where 𝛤𝐴S is the Raman anti-Stokes capture coefficient, 𝜌𝐴s(𝑇) is the Bose-Einstein probability distribution of photons for the anti-Stokes lines at the temperature 𝑇 and 𝛼AS is the anti-Stokes attenuation coefficient of the optical fiber for a given wavelength. For any 𝜌𝐴s(𝑇):
\( P_{o u t, A S}(z, T)=P_0 \Gamma_{A S} \int_0^z \rho_{A S}(T(z)) e^{-\alpha_{A S} z} d z \) (10)
For sampled signal 𝑧=𝑖 , 𝑧𝑖=0,1, 2, 3,..., n:
\( P_{\text {out }, A S}\left(z_n, T_n\right)=P_0 \Gamma_{A S} \sum_{i=0}^n \rho_{A S}\left(T\left(z_i\right)\right) e^{-\alpha_{A S} z_i} \Delta z \) (11)
where 𝑛 presents the number of samples. Applying the trapezoidal rule for integration, one can rewrite:
\( P_{\text {out }, \Delta S}\left(z_n, T_n\right)=P_0 \Gamma_{A S} \sum_{i=0}^n \rho_{A S}\left(T\left(z_i+\frac{\Delta z}{2}\right)\right) e^{-\alpha_{A S}\left(z_i+\frac{\Delta z}{2}\right)} \Delta z \) (12)
where Δ𝑧𝑖 =𝑧𝑖−𝑧𝑖−1 and 𝑧𝑖 =Δ𝑧∗𝑖. Substituting
\( A_{A S i}=e^{-\alpha_x\left(z_i+\frac{\Delta z}{2}\right)} \) (13)
the simplified form of (12) takes a form:
\( P_{\text {out }, A S}\left(z_n, T_n\right)=P_0 \Gamma_{A S} \sum_{i=0}^n \rho_{A S}\left(T\left(z_i+\frac{\Delta z}{2}\right)\right) A_{A S i} \Delta z \) (14)
For any n the matrix 𝑨AS is valid:
\( \boldsymbol{P}_{\text {out }, A S}=P_0 \Gamma_{\text {AS }} \boldsymbol{A}_{\boldsymbol{A S}} \cdot \boldsymbol{\rho}_{\boldsymbol{A S}} \) (15)
where 𝑷out,AS is the column vector of the measured scattered Raman radiation. Finally, distribution of tempera-ture along the optical fibre can be retrieved for 𝝆𝑨s column.
\( \rho_{A S}=\frac{1}{P_0 \Gamma_{A S}} A_{A S}^{-1} \cdot P_{\text {out }, A S} \) (16)
𝑨AS is the triangular matrix, thus one may solve (16) iteratively in order to speed up the calculations:
\( \rho_{A S 0}=\frac{1}{P_0 \Gamma_{A S}} \frac{P\left(\frac{\Delta z}{2}\right)}{e^{-\frac{\Delta z}{2}}} \) (17)
\( \boldsymbol{\rho}_{A S i}=\frac{1}{P_0 \Gamma_{A S}} \frac{P\left(i \Delta z+\frac{\Delta z}{2}\right)-P\left((i-1) \Delta z+\frac{\Delta z}{2}\right)}{e^{-\left(i \Delta z+\frac{\Delta z}{2}\right)}} \) (18)
Simulation model results
In order to verify the correctness of the proposed OTsDR algorithm and its capabilities, a simulation model was developed. The simulation model allows the proper choice of the DTS system components’ parameters, as well as the representation of the expected results from the DTS system. The simulation model script was prepared in Matlab. The parameters of the simulation model are presented in Table 2. The optical power of the laser diode (input power) was set to 20 mW, which turned out to be enough to observe the backscattered Raman anti-Stokes radiation and the temperature impact on its intensity. The optical fibre attenuation coefficient, the fibre refractive index and the Raman capture coefficient were chosen for a single-mode optical fibre at the operating wavelength of the laser diode of 1550 nm [17, 27]. The length of the optical fibre was set to 3 km, while the length of the optical fibre that is affected by the increased temperature was set to 1 km. The base temperature of the optical fibre is set to 20 °C, while the hotspot section of the optical fibre is set to 30 °C, 45 °C, and 60 °C.
Table 2.
The parameters of the simulated DTS system.
Laser diode |
Optical power |
20 mW |
Wavelength |
1550 nm |
|
Optical fibre |
Type |
SMF 28-e |
Length |
3000 m |
|
Hotspot length |
1000 m |
|
Raman Stokes |
Wavelength |
1660 nm |
Power attenuation |
0.22 dB/km |
|
Capture coefficient |
3.04 m-1 |
|
Raman anti-Stokes |
Wavelength |
1450 nm |
Power attenuation |
0.25 dB/km |
|
Capture coefficient |
4 m-1 |
Fig. 2(a) presents the simulation model results for the power of the integrated backscattered Raman anti-Stokes signals along the optical fibre, for different temperatures at the hotspot section. One may notice that the power of the backscattered Raman anti-Stokes rises along the optical fibre length, which, as mentioned in the mathematical simulation model (section 2), is summed for all the measured points along the optical fibre length. Fig. 2(b) presents the simulation model results for the temperature profile along the optical fibre obtained after applying the OTsDR algorithm to the data obtained in Fig. 2(a). One may notice that the temperature profile along the optical fibre obtained from the simulation model presents an accurate temperature difference between the base temperature of the optical fibre and the temperature of the hotspot sections of the optical fibre, thus provides a validation of the novel analysis approach and the demodulation algorithm presented in the mathematical simulation model (section 2). The results obtained from the simulation model of the OTsDR approach are promising and present the potential of its implementation in DTS systems.


Materials and methods
The experimental set-up for the DTS system based on the OTsDR approach is presented in Fig. 3. For this paper, the distributed-feedback (DFB), low-power laser diode (20 mW) is chosen as the light source, to verify the capabilities of the proposed OTsDR approach in temperature sensing using a low-power light source.

The laser diode is in a coaxial package with bracket and has a single-mode optical fibre pigtail. The operating wavelength of the laser diode is 1550 nm which is the preferred operation wavelength for remote temperature measurements due to the low attenuation coefficient of the optical fibres at this wavelength [27]. The laser diode is driven by a control unit which was specially designed in order to allow the setting of the laser pulse duration and pulse period [47]. The optical circulator is chosen with the same operating wavelength as the laser diode and has single-mode optical fibre pigtails. The tested optical fibre is a single-mode SMF-28e+. The tested optical fibre is divided into three sections: the first and last section were placed in the room temperature outside the heat chamber, while the second section was placed inside the heat chamber in order to change its temperature. Each of the three sections of the optical fibre is wound up around a spool. The heat chamber has a natural convection and has internal dimensions of 510 mm × 530 mm × 425 mm. The temperature inside the heat chamber was changed in the range of 20 °C–60 °C. One must notice not to exceed the temperature given in the optical fibre datasheet.
The backscattered light is divided by the wavelength division multiplexing (WDM) module into Rayleigh back-scattering band (1550 nm), Raman Stokes backscattering band (1660 nm), and Raman anti-Stokes backscattering band (1450 nm). One may register the Raman Stokes or Rayleigh bands in order to implement the demodulation algorithms which may help reduce the fibre link losses. In this paper, only the Raman anti-Stokes backscattered radiation is detected by a passively cooled avalanche photodiode (APD) which operating range is 800–1900 nm. The multiplication factor of APD is M = 30 at min. 45 V reverse voltage close to the breakdown limit. The APD also has a pigtailed single-mode optical fibre. The APD module is connected to a transimpedance amplifier (TIA) which converts the current detected by the APD to voltage. The voltage is then converted to a digital form by a 14-bit ADC. The trigger for data registration of the backscattered Raman anti-Stokes radiation starts alongside the laser radiation.
The registration process of the test results starts by choosing the desired system parameters: the APD operating voltage, the pulse duration of the laser diode operation, and the number of the registered frames for averaging. One must remember to set the operating voltage of the APD to be lower than the breakdown voltage in order to achieve the desired signal amplification whilst maintaining the respectful SNR. When the registration of the desired number of frames is finished, the saved results can be averaged and analysed. The analysis script was prepared in Matlab and it is based on the equations presented in the mathematical simulation model (section 2). Time needed in order to register, average and analyse the results depends on the desired number of frames and does not exceed 5 min. Fig. 4 presents the experimental set-up.

Results and discussion
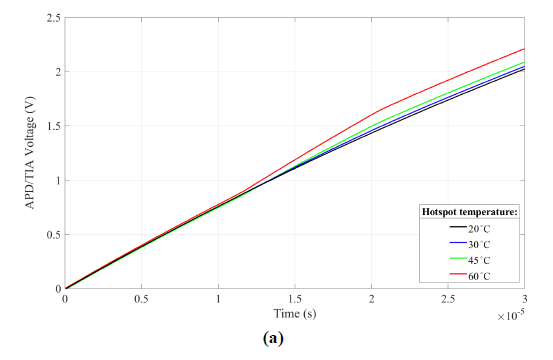
Fig. 5(a) and 5(b) present the primary results obtained from the experimental set-up which was prepared for testing the OTsDR approach ability to measure the temperature profile along the optical fibre. For the purposes of this paper, based on the length of the optical fibre (3 km), the impulse duration is set to 25 μs in order to guarantee the filling of the whole length of the optical fibre with laser light for each registered frame. The system registers 100 000 frames for averaging. The 14-bit ADC has the sample rate of 100 mega samples per second (Ms/s). Moreover, after a series of experiments, the operating voltage of the APD is set to 40 V because the obtained signal amplification is sufficient and the noise is relatively lower than the noise generated for other, higher operating voltages.

The optical fibre under test is 3 km long, and consists of three sections: 1 km, 1 km, and 1 km. A division into three sections allows leading the optical fibre through the openings of the heat chamber. The three sections of the optical fibre have the same, identical optical properties, and are fusion-spliced to each other in order to reduce losses and reflections which can be high if optical fibre connectors are used. The second optical fibre section, 1 km long, is placed in a heat chamber, where its temperature is changed and monitored. Initially, a constant temperature profile along the whole optical fibre at 20 °C is measured and defined as the reference measurements point. The temperature inside the heat chamber is then set consecutively to three values: 30, 45 and 60 °C, as shown in Fig. 5(a) and 5(b). The temperature in the heat chamber is monitored by the integrated temperature sensor and by an additional thermocouple. The temperature inside the heat chamber is maintained during the data registration for each temperature setting.
The proposed OTsDR approach is implemented in the analysis of the experimental results. Also, correction and calibration algorithms, using a low-pass filter and Kalman filter, are applied to enhance the quality of the results. The obtained test results coordinate with the results obtained from the mathematical model for the OTsDR approach. One may notice the “noisy” character of the experimental results in contrast to the simulation model results which present an ideal form of a temperature profile. The experimental results present an actual temperature profile along the optical fibre, demonstrating the inhomogeneity of temperature resulting from the optical fibre being wound up around a spool. Moreover, the optical fibre sections, which are placed outside the heat chamber, do not have a stable temperature during the measurements. This is due to the heat generated by the electronics of the system set-up and room temperature that could change due to the presence and movement of the system operators.
Another set of results is presented in Fig. 6, where a 2 km optical fibre, with around 200 m hotspot section is tested. One may observe the capability of the proposed algorithm to obtain the temperature profile along shorter hotspot sections. Again, the experimental results have a noisy character, resulting from the actual temperature changes along the whole optical fibre.

Based on the obtained simulation and experimental results, it is safe to state that the aim of this paper is achieved. The proposed OTsDR algorithm is capable of the reconstruction of the temperature profile along the tested optical fibre, using the simple differential analysis of the integrated Raman anti-Stokes backscattered signals. The proposed approach does not suffer from dead measurement zones and phase noise. The construction of the DTS system based on the OTsDR approach is simple, cost-effective, and reliable. The presented DTS system has a temperature resolution of 2 °C. As mentioned, the spatial resolution of the presented system depends on the sampling rate of the ADC, while the spatial range depends on the pulse duration length. The current set-up allows the measurements for up to 15 km, with a resolution of 20 m.
The results are promising and can be easily improved, especially the spatial resolution of the system, by implementing an ADC with higher resolution and sampling rate. One may also enhance the quality of the results by improving the SNR of the registered Raman anti-Stokes backscattered signals through the implementation of the cooled APD module and a low-noise TIA.
Conclusions
This paper presents the OTsDR for remote temperature sensing based on Raman anti-Stokes scattering. The system is simulated in Matlab in order to explore the capabilities and the potentials of this system to detect the temperature profile along the optical fibre based on the low-cost and simple set-up. The simulation model is prepared based on the experimental set-up that is intended to be used for measurements. The results obtained from the measure-ments prove the capability of the OTsDR system to detect the temperature profile along the optical fibre in accord-ance with the simulation model.
The novel approach for data analysis in the DTS systems presented in this paper allows the use of low optical power laser diodes, while maintaining the respectful spatial range and spatial resolution. This can be obtained by the implementation of a more powerful ADC with a higher sampling rate than the used ADC in this paper. The results presented in this paper were obtained from a 14-bit, 100 MHz ADC. The implementation of a 1 GHz ADC will allow the system to reach up to a 1 m spatial resolution. The temperature resolution of the DTS system presented in this paper is 2 °C.
In contrast to the OTDR method which is based on the measurements of the backscattered light of the short (0.2–10 ns) high-power (1–70 W) laser pulses, the OTsDR approach relies on the measurements of the backscattered light of the long (1–50 μs) low-power (less than 50 mW) laser pulses. The high optical power laser is expensive and might endanger the staff and reduce the possibilities of implementing the DTS system in explosive environments. Further research on implementing a lower optical power laser diode is planned using a lower power laser diode ( < 20 mW). The OTsDR approach also does not require expensive complicated equipment such as the VNA and the EOM required in the OFDR method. The time needed for registering and averaging the measurements is comparable to the time needed in the OTDR and OFDR methods.
Authors’ statement
Research concept and design, B.W. and I.S.M.S.; collection and/or assembly of data, I.S.M.S.; data analysis and interpretation, B.W. and I.S.M.S.; writing the article, I.S.M.S.; critical revision of the article, R.O.; final approval of article, I.S.M.S., R.O. and B.W.
References
-
Abramczyk, H. et al. A look into the use of Raman spectroscopy for brain and breast cancer diagnostics: linear and non-linear optics in cancer research as a gateway to tumor cell identity. Expert Rev. Mol. Diagn. 20, 99–115 (2020). https://doi.org/10.1080/14737159.2020.1724092
-
Brozek-Pluska, B. & Kopec M. Raman microspectroscopy of Hematoporphyrins. Imaging of the noncancerous and the cancerous human breast tissues with photosensitizers. Spectrochim. Acta A 169, 182–191 (2016). https://doi.org/10.1016/j.saa.2016.06.038
-
Lu, P. et al. Distributed optical fiber sensing: Review and perspective. Appl. Phys. Rev. 6, 041302 (2019). https://doi.org/10.1063/1.5113955
-
Palla, M. et al. Click Chemistry Based Biomolecular Conjugation Monitoring Using Surface-Enhanced Raman Spectroscopy Mapping. in 2016 IEEE SENSORS 1–3 (IEEE, 2016).https://doi.org/10.1109/ICSENS.2016.7808595
-
Hermans, T., Nguyen, F., Robert, T. & Revil, A. Geophysical methods for monitoring temperature changes in shallow low enthalpy geothermal systems. Energies 7, 5083–5118 (2014). https://doi.org/10.3390/en7085083
-
Onorato, G., Persichetti, G., Grimaldi, I. A., Testa, G. & Bernini, R. Optical fiber fuel level sensor for aeronautical applications. Sens. Actuators A: Phys. 260, 1–9 (2017). https://doi.org/10.1016/j.sna.2017.04.015
-
Smolen, J. J. & van der Spek, A. Distributed temperature sensing – A DTS primer for oil & gas production. Report (2003) (Accessed: 17th December 2023). https://www.scribd.com/document/39113402/Shell-DTS-Primer
-
Cho, J. et al. Development and improvement of an intelligent cable monitoring system for underground distribution networks using distributed temperature sensing. Energies 7>, 1076–1094 (2014). https://doi.org/10.3390/en7021076
-
Chen, K., Yue, Y. & Tang, Y. Research on temperature monitoring method of cable on 10 kV railway power transmission lines based on distributed temperature sensor. Energies 14, 3705 (2021). https://doi.org/10.3390/en14123705
-
Selker, J. S. et al. Distributed fiber-optic temperature sensing for hydrologic systems. Water Resour. Res. 42, W12202 (2006). https://doi.org/10.1029/2006WR005326
-
Yang, C., Chen, S. & Yang, G. Fiber optical liquid level sensor under cryogenic environment. Sens. Actuators A: Phys. 94, 69–75 (2001). https://doi.org/10.1016/S0924-4247(01)00663-X
-
Keller, C. A. et al. Fiber optic distributed temperature sensing for the determination of the nocturnal atmospheric boundary layer height. Atmos. Meas. Tech. 4, 143–149 (2011). https://doi.org/10.5194/amt-4-143-2011
-
Masoudi, A. & Newson, T. P. Contributed review: Distributed optical fibre dynamic strain sensing. Rev. Sci. Instrum. 87, 011501 (2016). https://doi.org/10.1063/1.4939482
-
Kharaz, A. & Jones, B. E. A distributed optical-fibre sensing system for multi-point humidity measurement. Sens. Actuators A: Phys. 47, 491–493 (1995). https://doi.org/10.1016/0924-4247(94)00948-H
-
Shatarah, I. S. M. & Więcek, B. The Application of NIR Spectrometer for Average Temperature Measurement in Optical Fibers Based on Spontaneous Raman Scattering for DTS Applications. in 27th International Conference on Mixed Design of Integrated Circuits and System (MIXDES) 192–196 (2020). https://doi.org/10.23919/MIXDES49814.2020.9155569
-
Senior, J. M. & Jamro, M. Y. Transmission characteristics of optical fibers. in Optical Fiber Communications: Principles and Practice, 3rd ed 151–153 (Pearson Education Limited, 2009).
-
Yilmaz, G. & Karlik, S. E. A distributed optical fiber sensor for temperature detection in power cables. Sens. Actuators A: Phys. 125, 148–155 (2006). https://doi.org/10.1016/j.sna.2005.06.024
-
Palmieri, L. & Schenato, L. Distributed optical fiber sensing based on Rayleigh scattering. Open Opt. J. 7, 104–127 (2013). https://doi.org/10.2174/1874328501307010104
-
Wuilpart, M. et al. Measurement of Magnetic Field Using Rayleigh Backscattering in Optical Fibres. in 2nd International Conference on Advancements in Nuclear Instrumentation, Measurement Methods and their Applications 1–6 (IEEE, 2011). https://doi.org/10.1109/ANIMMA.2011.6172873
-
Thomas, P. J. & Hellevang, J. O. A fully distributed fibre optic sensor for relative humidity measurements. Sens. Actuators B: Chem. 247, 284–289 (2017). https://doi.org/10.1016/j.snb.2017.02.027
-
Shangguan, M. et al. Brillouin optical time domain reflectometry for fast detection of dynamic strain incorporating double-edge technique. Opt. Commun. 398, 95–100 (2017). https://doi.org/10.1016/j.optcom.2017.04.033
-
Bastianini, F., Corradi, M., Borri, A. & di Tommaso, A. Retrofit and monitoring of an historical building using ‘‘Smart’’ CFRP with embedded fibre optic Brillouin sensors. Constr. Build Mater. 19, 525–535 (2005). https://doi.org/10.1016/j.conbuildmat.2005.01.004
-
Siwowski, T., Rajchel, M., Sienko, R. & Bednarski, L. Smart Monitoring of the FRB Composite Bridge with Distributed Fibre Optic Sensors. in 9th International Conference on Fibre-Reinforced Polymer (FRP) Composites in Civil Engineering (CICE) 916–926 (CICE, 2018).
-
Du, A., Dutta, S., Kurup, P., Yu, T. & Wang, X. A review of railway infrastructure monitoring using fiber optic sensors. Sens. Actuators A: Phys. 303, 111728 (2020). https://doi.org/10.1016/j.sna.2019.111728
-
Suarez, F., Hausner, M. B., Dozier, J., Selker, J. S. & Tyler S. W. Heat Transfer in the Environment: Development and Use of Fiber- Optic Distributed Temperature Sensing. in Developments in Heat Transfer (ed. Dos Santos Bernardes, M. A.) 611–636 (InTech, 2011). https://doi.org/10.5772/19474
-
Ukil, A., Braendle, H. & Krippner, P. Distributed temperature sensing: Review of technology and applications. IEEE Sens. J. 12, 885–892 (2012). https://doi.org/10.1109/JSEN.2011.2162060
-
Farahani, A. & Gogolla, T. Spontaneous Raman scattering in optical fibers with modulated probe light for distributed temperature Raman remote sensing. J. Light. Technol. 17, 1379–1391 (1999). https://doi.org/10.1109/50.779159
-
Xia, T., Guo, J., Li, X. & Mao, X. A Modified Demodulation Algorithm for Fiber-Optic Distributed Temperature Sensing System Based on Raman Scattering. in 2012 Photonics Global Conference (PGC) 1–3 (IEEE, 2012). https://doi.org/10.1109/PGC.2012.6458071
-
Liu, Y. & Zongjiu, Z. Design of Distributed Fiber Optical Temperature Measurement System Based on Raman Scattering. in 2010 International Symposium on Signals, Systems and Electronics 1–4 (IEEE, 2010). https://doi.org/10.1109/ISSSE.2010.5607025
-
Kikuchi, I., Naito, T. & Okoshi T. Measurement of Raman scattering in single-mode optical fiber by optical time-domain reflectometry. IEEE J. Quantum Electron. 24, 1973–1975 (1988). https://doi.org/10.1109/3.8529
-
Liokumovich, B., Ushakov, N. A., Kotov, O. I., Bisyarin, M. A. & Hartog, A. H. Fundamentals of optical fiber sensing schemes based on coherent optical time domain reflectometry: Signal model under static fiber conditions. J. Light. Technol. 33, 3660–3671 (2015). https://doi.org/10.1109/JLT.2015.2449085
-
Geng, J., Xu, J., Li, Y., Wei, G. & Guo, C. The development of the model and arithmetic for the fully distributed fiber optic sensor based on Raman optical-fiber frequency-domain reflectometry (ROFDR). Sens. Actuators A: Phys. 101, 132–136 (2002). https://doi.org/10.1016/S0924–4247(02)00208–X
-
Lu, P. et al. Distributed optical fiber sensing: Review and perspective. Appl. Phys. Rev. 6, 041302 (2019). https://doi.org/10.1063/1.5113955
-
Chen, Y. et al. A Fast high-spatial-resolution Raman distributed temperature sensor. Proc. SPIE 9157, 91575M (2014). https://doi.org/10.1117/12.2058109
-
Soto, M. A. et al. Raman-based distributed temperature sensor with 1m spatial resolution over 26 km SMF using low-repetition-rate cyclic pulse coding. Opt. Lett. 36, 2557–2559 (2011). https://doi.org/10.1364/OL.36.002557
-
Stoddart, P. R. et al. Fibre optic distributed temperature sensor with an integrated background correction function. Meas. Sci. Technol. 16, 1299–1304 (2005). https://doi.org/10.1088/0957-0233/16/6/009
-
Feced, R., Farhadiroushan, M., Handerek, V. A. & Rogers A. J. Advances in high resolution distributed temperature sensing using the time-correlated single photon counting technique. IEE Proc. Optoelectron. 144, 183–188 (1997). https://doi.org/10.1049/ip-opt:19971183
-
Karamehmedovića, E. & Glombitzab, U. Fiber-optic distributed temperature sensor using incoherent optical frequency domain reflectometry. Proc. SPIE 5363, 107–115 (2004). https://doi.org/10.1117/12.528794
-
Silva, L. C. B, Pontes, M. J. & Segatto, M. Analysis of Parameters for a distributed temperature sensing based on Raman scattering. J. Microw. Optoelectron. Electromagn. Appl. 16, 259–272 (2017). https://doi.org/10.1590/2179-10742017v16i1886
-
Cherukupalli, S. & Anders, G. J. Distributed Fiber Optic Sensing and Dynamic Rating of Power Cables. (John Wiley & Sons, Inc., 2020).
-
Mai, T. V., Molnar, J. A. & Tran, L. H. Fiber optic test equipment – evaluation of OTDR dead zones and ORLM return loss. in Proc. AUTOTESTCON 94–98 (2004).https://doi.org/10.1109/AUTEST.2004.1436782
-
Feced, R., Farhadiroushan, M. & Handerek, V. A. Zero dead-zone OTDR with high-spatial resolution for short haul applications. IEEE Photon. Technol. Lett. 9, 1140–1142 (1997). https://doi.org/10.1109/68.605529
-
Yuksel, K., Wuilpart, M., Moeyaert, V. & Megret, P. Optical Frequency Domain Reflectometry: A Review. in 11th International Conference on Transparent Optical Networks 1–5 (IEEE, 2009). https://doi.org/10.1109/ICTON.2009.5185111
-
Arbel, A. & Eyal, A. Dynamic optical frequency domain reflectometry. Opt. Express 22, 8823–8830 (2014). https://doi.org/10.1364/OE.22.008823
-
Fan, X. Koshikiya, Y., Araki, N. & Ito, F. Field trials of PNC-OFDR in different environments for detecting short beat lengths. IEEE Photonics Technol. Lett. 24, 1288–1291 (2012). https://doi.org/10.1109/LPT.2012.2201935
-
Martinez-Pinon, F., Alvarez-Chavez, J. A., De la Cruz–May, L. & Martinez-Romero, G. Optimum peak pulse investigation for OTDR instrumentation. Laser Phys. 18, 907–910 (2008). https://doi.org/10.1134/S1054660X08070153
-
Shatarah, I. S. M. & Więcek, B. Application of software-defined radio for Rayleigh and Raman scattering measurement in optical fibers. Meas. Autom. Monitor. 64, 112–115 (2018). https://yadda.icm.edu.pl/baztech/element/bwmeta1.element.baztech-0bfce09f-f3fb-4d16-abfd-3890a593d922/c/Shatarah_application_MAM_4_2018.pdf