Institute of Applied Physics, Military University of Technology, ul. gen. Sylwestra Kaliskiego 2, 00-908 Warsaw, Poland
National Institute of Telecommunications, ul. Szachowa 1, 04-894 Warsaw, Poland
Faculty of Electronics and Information Technology, Institute of Electronic Systems, Warsaw University of Technology,
ul. Nowowiejska 15/19, 00-665 Warsaw, Poland
An intensity-based refractive index (RI) sensor using a laser micromachined side-hole
optical fibre (S-H OF) is presented in this paper. To achieve this, a microcavity was cut into
a side surface of the S-H OF, providing access to one of the air holes within its structure.
The geometrically modified fibre was then connected at both ends to a single-mode fibre for
structure investigation in a system containing a supercontinuum laser and an optical signal
analyser. In the next step, an immersion liquid was applied to a microcavity for RI values
ranging from 1.30 to 1.57 in increments of 0.02. Power loss measurements were conducted
for each RI value. Based on the obtained results, it can be concluded that an RI sensor has
been successfully developed, which holds potential applications in biochemistry.
Introduction
In the last decade, there has been a remarkable progress in
the field of fibre optic sensor (FOS) technology. FOSs play
a significant role due to their numerous advantages over
traditional sensors [1, 2]. These include immunity to
electromagnetic interference, high resolution and accuracy,
compact size, suitability for long-distance applications, and
resilience to high temperatures [3, 4]. Many experimental
FOS setups have already found their way into practical
applications across various domains. The increasing
demand for special fibres with unique characteristics has
pushed academic and industrial environments to develop
technologies enabling the creation of sophisticated FOS
systems [5–7]. The main challenge in manufacturing the
FOS is to achieve the ability to interact with the parameters
of the light passing through its core which is typically
surrounded by cladding. It is necessary to modify its
geometry to make the fibre sensitive to changes in the
environmental conditions in which it is placed. Modification
of the structure can occur through intervention in the facet
or side-surface of the fibre [8, 9]. Methods such as D-shape
fibre formation [10, 11], chemical etching [12, 13],
polishing [14, 15], tapering [16, 17], and laser micromachining
[18–20] can be employed for this purpose.
Among the mentioned techniques, laser micromachining is
one of the most precise methods for shaping the surface of
an optical fibre, commonly used to create cavity structures.
This technological procedure allows access to the fibre
core, which enables the interaction of the light passing
through it with the surrounding medium. This sensor allows
for the measurement of specific physical parameters by
detecting changes in the external refractive index (RI)
[21, 22]. The cut length of the cavity plays a crucial role in
determining optical losses, the most significant parameter
in these sensors. These losses can be easily measured and
translated into precise changes in the cavity environment,
essentially functioning as a sensor. The RI of the external
material serves as a significant external factor affecting the
signal propagation in the microcavity sensor system.
Consequently, the measurement of RI finds widespread
application across diverse fields, such as environmental
monitoring, biochemical sensing, and medicine [23–26].
The side-hole optical fibre (S-H OF) is a special fibre that
serves as the foundation for many detection systems
distinguished by its unique geometry [27, 28]. It is composed of an elliptical core and two air tunnels nearby. Conducting micromachining on such a fibre allows access to one of the air holes, enabling interaction with the propagating light by filling the manufactured microcavity with an external material [29, 30].
Microcavities fabricated on the surface of optical fibres exhibit resonant characteristics due to light interference within the cavity. When light enters the microcavity, it reflects multiple times between the cavity walls, creating standing waves at specific resonant wavelengths. The resonant condition is highly sensitive to changes in the external RI surrounding the microcavity [31, 32]. As the external RI increases, the effective RI within the cavity changes, which alters the resonance conditions [33]. The technological work presented in this article specifically focuses on creating an intensity sensor using cavity structures on S-H OF.
Techniques
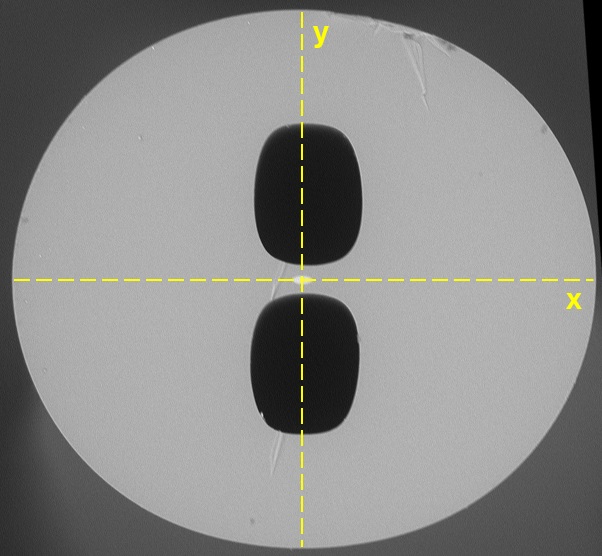
Before initiating the laser micromachining of the cladding layer, the S-H OF was pre-positioned so that the shorter y‑axis was vertical (Fig. 1).
Fig. 1. Adopted coordinate system in the cross-section of the S-H OF.
The micromachining process was conducted in an ultra-precise multi-axis positioning system and femtosecond laser operating at 1030 nm wavelength. The laser provides pulses of a duration of 320 fs with a repetition rate of 1 kHz and a single pulse energy of 6.5 μJ. The S-H OF is fixed in holders and precisely positioned under the microscope objective. Specialized software for controlling the laser pulse triggering and the movement of the multi-axis positioning system allows for arbitrary material removal with a sub-micrometer precision. The spot size is limited by the numerical aperture (NA) of the objective used in the process. With a wavelength of 1031 nm and NA = 0.4, the spot size in the focal plane is estimated to be around 1.3 μm in diameter. The effective area of the ablation of the material from the fibre is larger and close to 3 μm. The microcavity is created by the line-by-line removal of a thin layer of glass material. The process is repeated layer-by-layer until the required depth of the microcavity is reached.
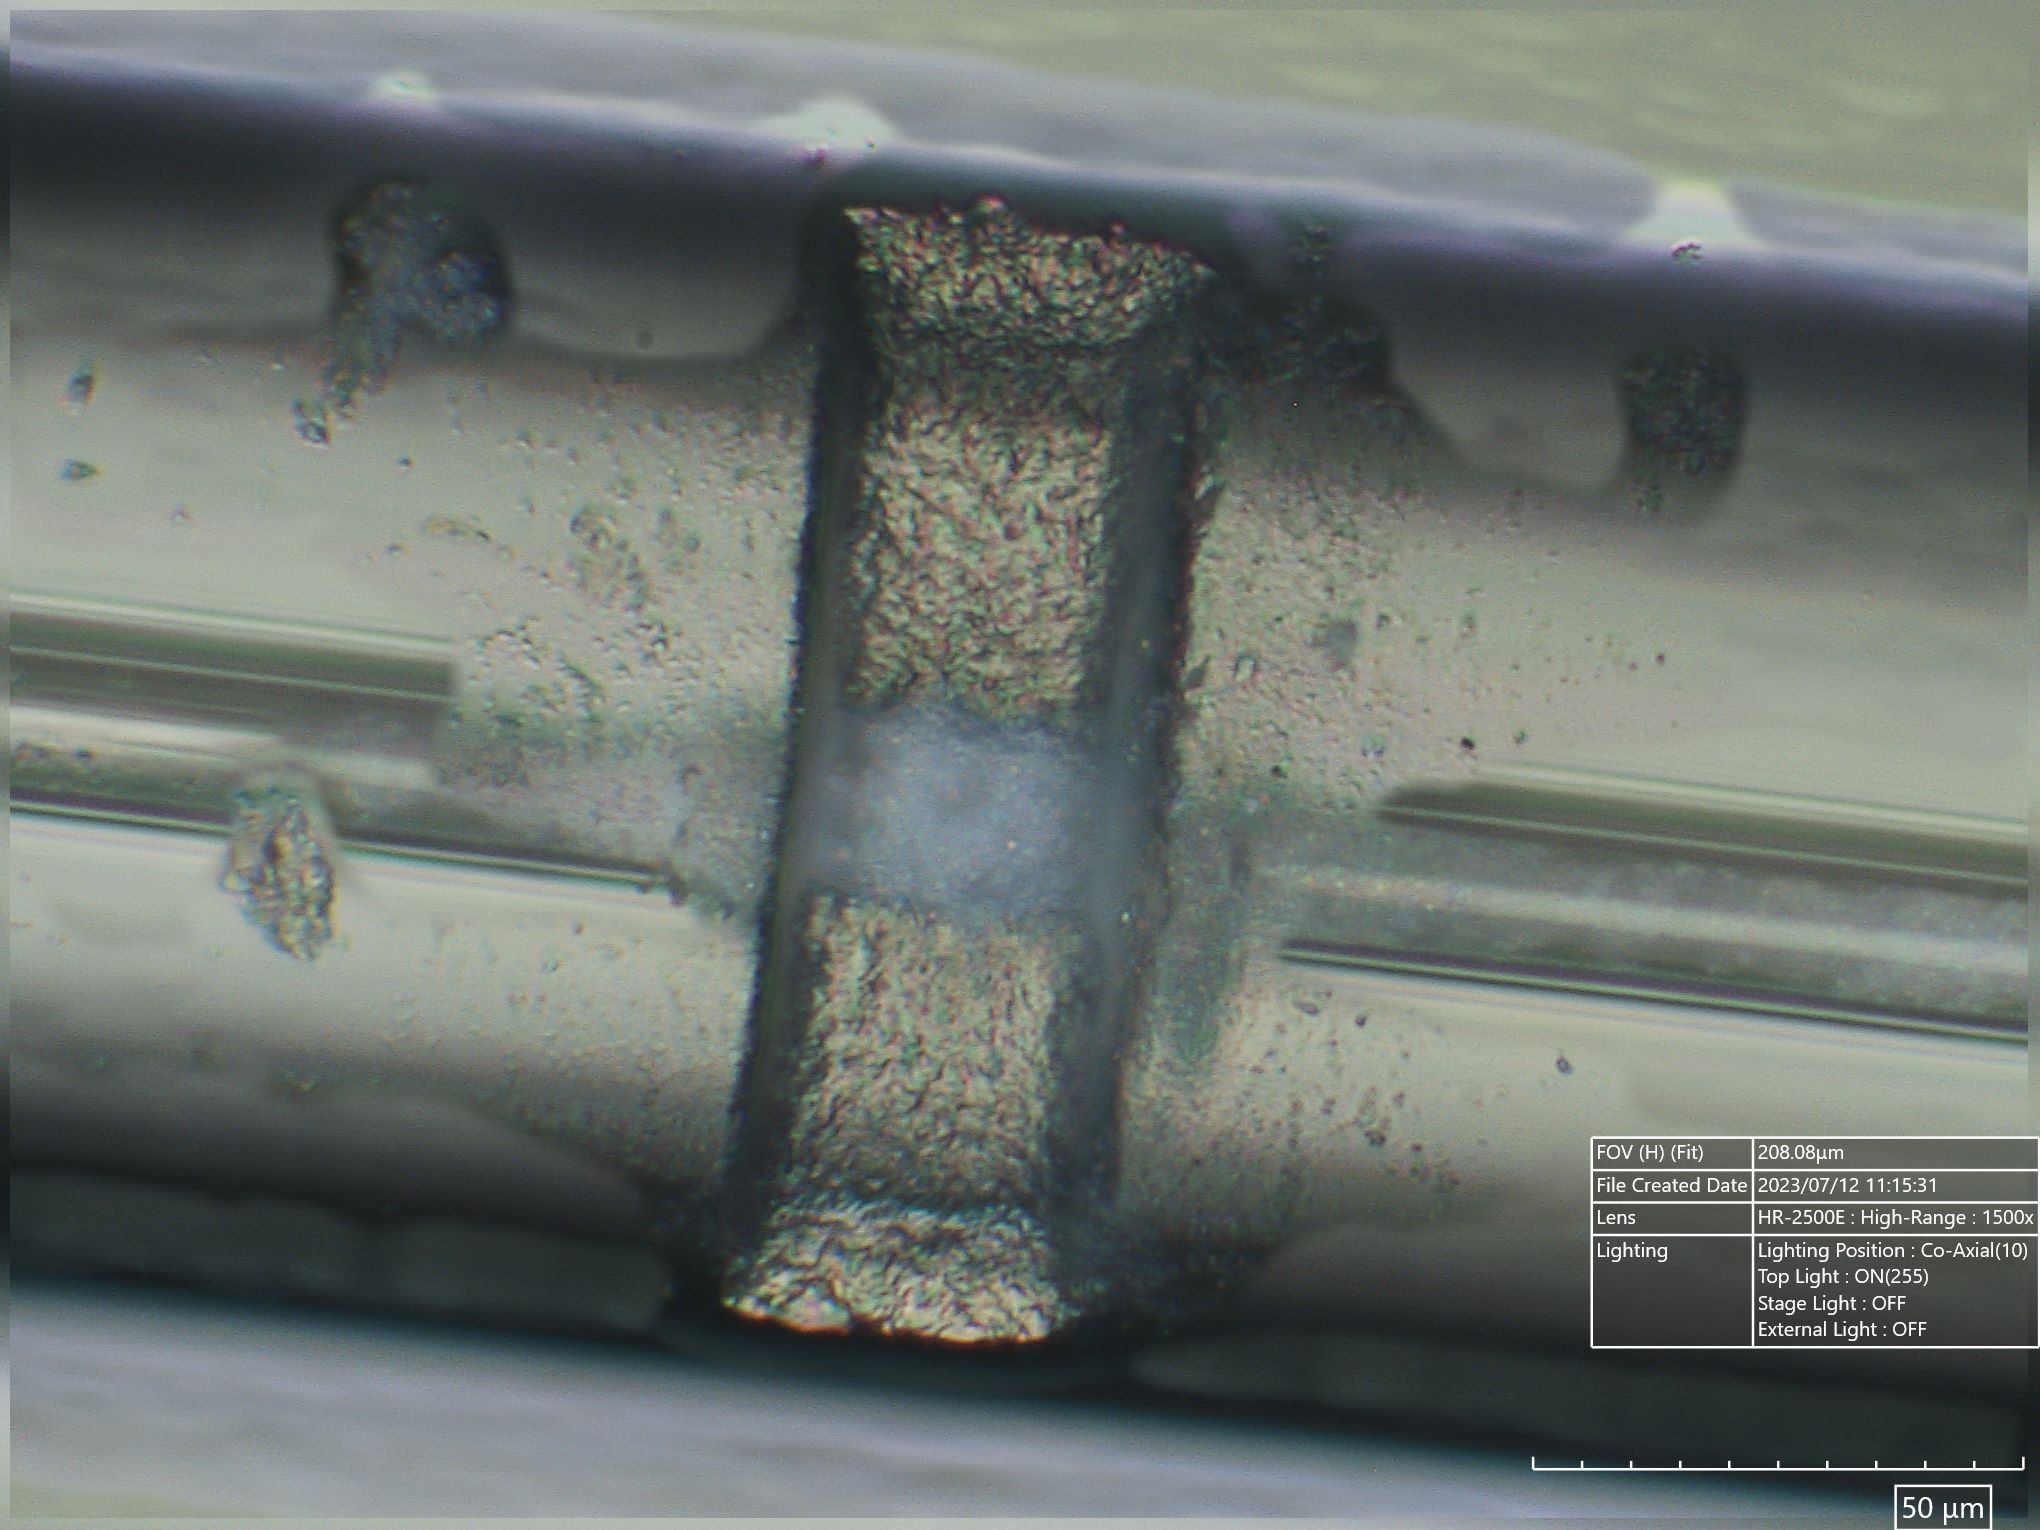
The final result of the micromachining was the creation of a microcavity providing access to one of the air tunnels with the following parameters: depth 40 ± 0.5 μm, length 35 ± 0.5 μm (first combination), length 60 ± 0.5 μm (second combination). The surface of the S-H OF after micro-machining meets the desired dimensions and exhibits slight roughness (estimated ~ 3 μm). Courtesy of Technolutions, sample images were captured using a HIROX-HRX-01 system. An example photo is presented in the illustration below (Fig. 2).
Fig. 2. Picture of a microcavity with a length of 35 μm manufactured on the S-H OF.
Micromachined S-H OF was spliced with a standard SMF fibre at both ends with the use of a VYTRAN FFS-2000WS fusion splicer. The spliced SMF–S-H OF structure was linked with FC/PC connectors to a supercon-tinuum source at one end and an optical signal analyzer at the other. In the next step, an immersion liquid was applied to the microcavity with RI values ranging from 1.3 to 1.57 in increments of 0.02. Direct observation of the cavity under a microscope confirms that the capillary forces and viscosity of the oils used in the experiment enable a very effective filling. After applying the liquid to the microcavity, the influence of its application on the spectral characteristics was examined, followed by cleaning it with 99.8% isopropanol. Preceding the application of the immersion liquid by the process of splicing the S-H OF with the SMF generates pressure in the air tunnel, which prevents the liquid from entering the holes. The impact of the subsequent RI on transmission was studied after restoring the optical power to the reference level. The optical power losses for each immersive liquid were examined for the 1200–2400 nm wavelength range. The research was conducted for microcavities of 35 μm and 60 μm widths.
Results
The Fiber Optics Technology Laboratory at Maria Curie-Skłodowska University in Lublin, Poland, manufactured the S-H OF used in research. The produced fibre featured an elliptical core of 1 × 2 ± 0.1 μm and air holes with dimensions of 20 × 35 ± 0.1 μm.
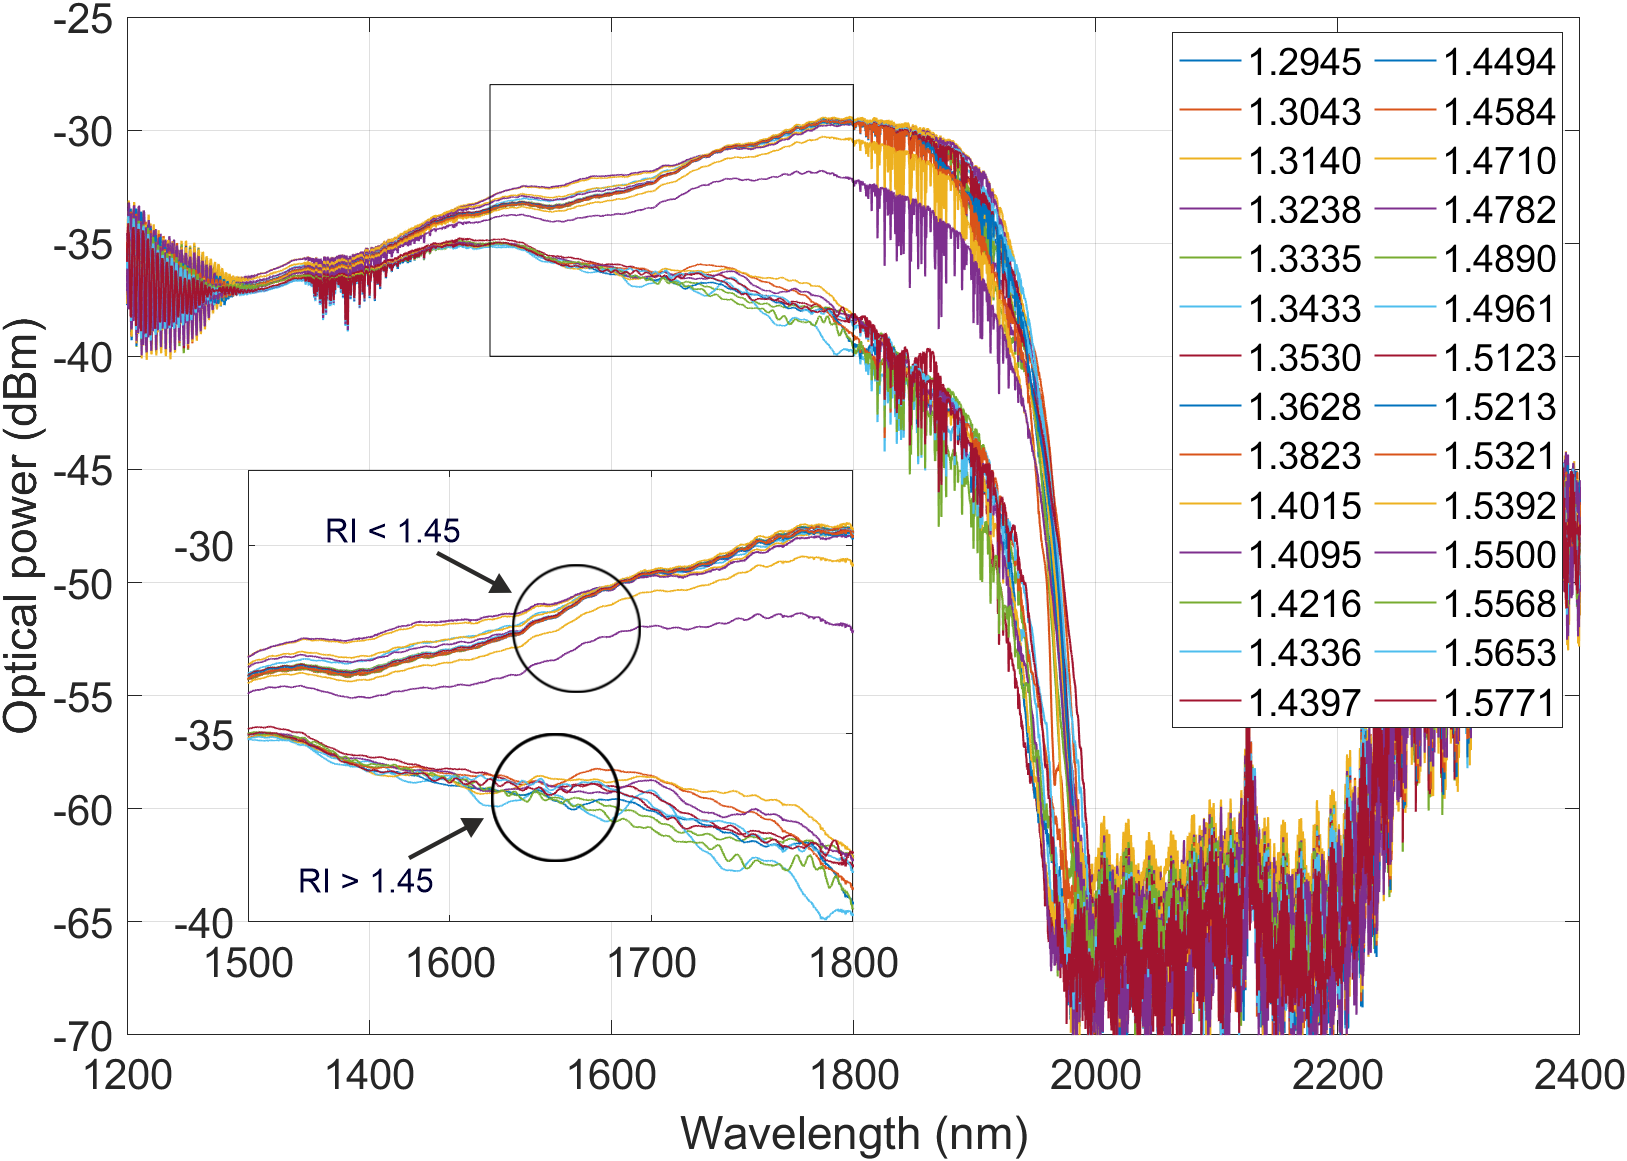
In the first step, the effect of immersing the liquid on the spectral characteristics of the 35 μm microcavity was examined. In the studies on the sensitivity of the external RI, immersion liquids in the 1.3–1.57 RIU (refractive index unit) range were used. It should be noted that RI is unitless (as the ratio of the speed of light in a vacuum to the speed of light in a particular medium), however, RIU is commonly used for describing RI sensors sensitivity, i.e., dB/RIU [29]. The optical power characteristics were plotted for a given wavelength. The chart presented is an average of the three-measurement series for each RI value (Fig. 3). All measurements were carried out at room temperature.
Fig. 3. Optical power dependence for applied immersion liquids
in a wide spectrum range (1200–2400 nm).
The results indicate a slight influence of immersion
liquids with the RI ranges of 1.3–1.45 and 1.49–1.57 on the
transmission spectrum. For both ranges, the results show
a constant level of transmission. In the next step of analysis
for the 35 μm microcavity, the 1500–1800 nm range was
used. The selection of the wavelength range is related to the
optical power characteristics of the microcavity, particularly
concerning the depth of light penetration and the associated
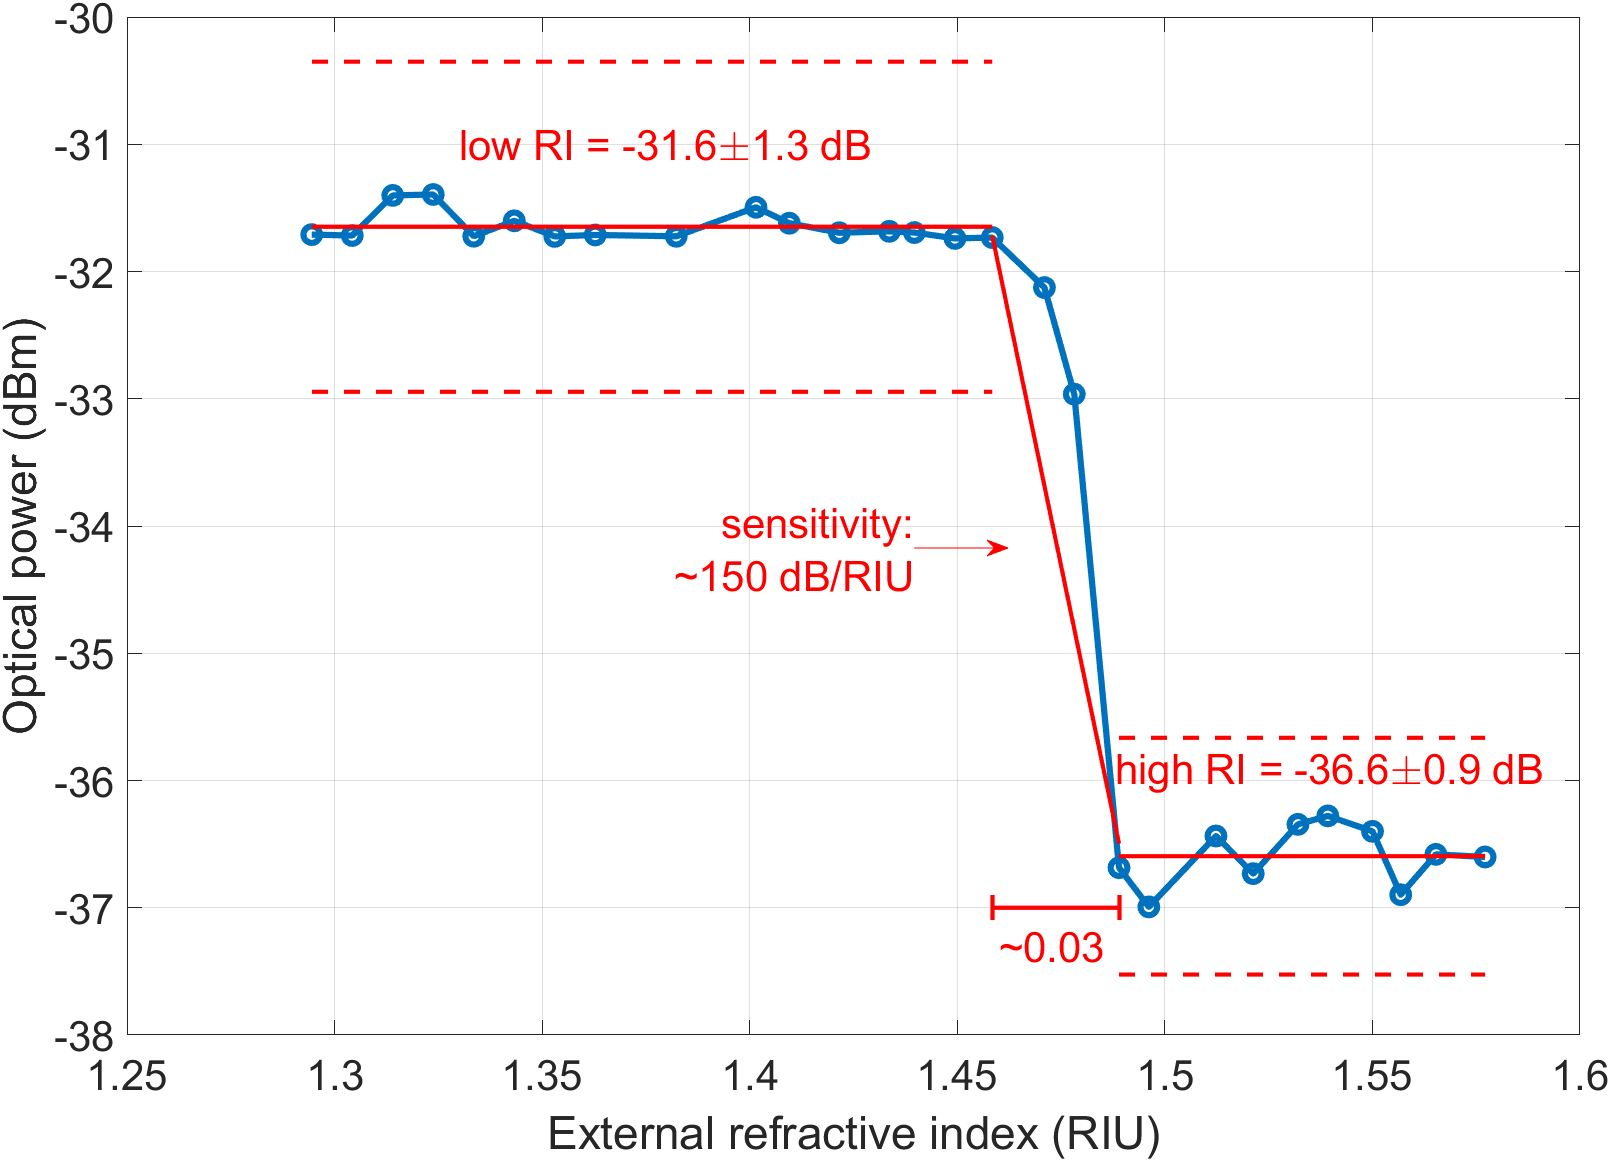
losses. The most distinctive range of the external RI is
1.46–1.49, where the highest dependence of the optical
power level on the deposited immersion liquid is observed,
with the sensitivity (SRI), described by the value of
the slope coefficient for the obtained curve [34–36],
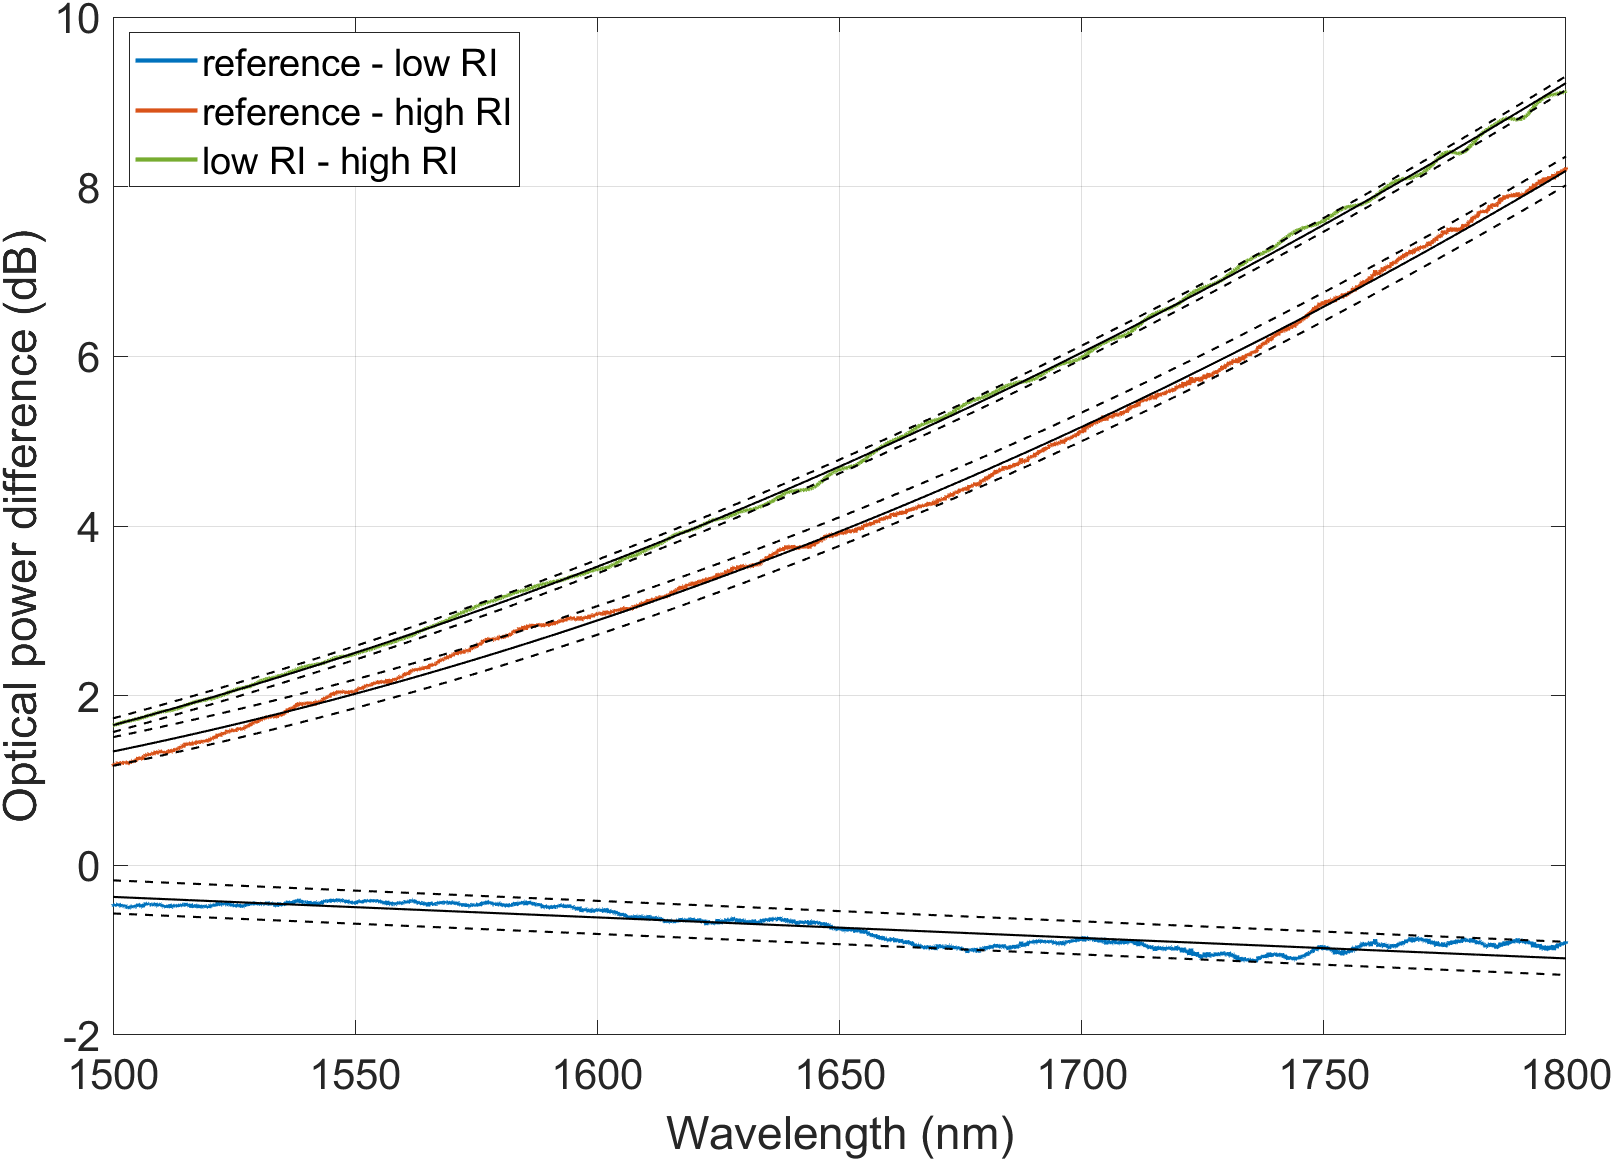
approximately equal to 150 dB/RIU. There is a noticeable
transition in optical power losses from an average
level of −31.6 dBm ± 1.3 dB for RIs below 1.46 to
−36.6 dBm ± 0.9 dB for RIs above 1.46. The following
charts depict the difference in the averaged optical power
spectra [Fig. 4(a)] and the averaged optical power values in
the 1500–1800 nm range [Fig. 4(b)].
Fig. 4. (a) Difference in averaged optical power spectra and (b) averaged optical power values in the range of 1500–1800 nm.
Further analysis focused on the narrower wavelength
range of 1540–1560 nm due to the highest stability of the
conducted measurements. Below are the results for the
second sample with similar geometric parameters (Fig. 5).
Fig. 5. (a) Optical power dependence for applied immersion liquids in the narrow spectrum range of 1540–1560 nm.
(b) Averaged optical power values in the range of 1540–1560 nm.
The obtained spectral characteristics for applied
immersion liquids in the range of 1.3–1.57 show disrupted
optical power levels in the RI range of 1.3–1.46, with the
highest power fluctuations observed at −32.5 dBm to
−33.7 dBm for an RI of 1.32. The transmitted power for the
RI range of 1.46–1.57 exhibited a constant optical power
level. Once again, as with the previous sample, there is
a noticeable power drop after exceeding an RI value of
1.46. The next research stage was conducted for a microcavity
with a length of 60 μm, using RIs in the range of
1.3–1.557. In the range from 1.3 to 1.46, no noticeable
changes were observed in the spectral characteristics. The
obtained results reveal characteristic wavelength dips for RIs
above 1.47. To thoroughly investigate this phenomenon,
studies were conducted on the influence of propagation
direction on the obtained spectral characteristics. Below are
the sample results of averaged optical power levels for RIs
of 1.504 and 1.522 in the wavelength range of 1200–
2000 nm (Fig. 6).
Fig. 6. The obtained spectral characteristics for both directions
of light input for the immersion liquid with an RI:
(a) 1.504, (b) 1.522.
The above results for both directions of light input into
the fibre show dips for the same wavelengths. The differences
in the transmitted power level for both directions
most likely result from variations in the optical loss values
of the splices. This article studies the distances between the
wavelength dips described as the resonance spectral range
(RSR). The spectral characteristics were examined for the
average RSR depending on the RI value (Fig. 7).
Fig. 7. The obtained RSR values of RIs ranging from 1.468
to 1.557.
An approximation of the obtained results indicated
a decreasing RSR value with an increase in the RI of the
applied immersion liquid. The sensitivity SRI of the tested
sensor system can be estimated from Fig. 7 at
~ 2621 nm/RIU. The RSR value for an immersion liquid
with an RI of 1.504 slightly disrupts the linear dependence
of RSR on external RI. It is worth noting the slight change
in the RSR values between RIs 1.504 and 1.522, where for
1.504, the RSR = 113 nm, while for 1.522, the RSR = 102 nm.
The greatest change in RSR value occurred between
immersion liquids with RIs of 1.486 and 1.504, where the
difference in RSR = 81 nm.
Changes in RSR values with variations in the external
RI are caused by changes in the resonance conditions.
When the external RI changes, the phase-matching
conditions for the light waves reflecting inside the cavity
are modified. This shift changes the specific wavelengths
that constructively interfere to form standing waves,
resulting in different wavelength dips.
Table 1 compares the external refractive index
sensitivity (SRI) of the sensor obtained in this work with the
sensitivity of sensors from other literature reports. The
authors included the 60 μm microcavity in the comparison
due to its higher sensitivity than the 35 μm microcavity.
The microcavity fabricated in this work exhibits
a relatively high sensitivity but only for the tested range of
RIs (1.464–1.557).
The high sensitivity of the presented sensor structure, in
the range of 1.464–1.557, paves the way for further research
into its chemical and biological applications.
Conclusions
In this study, the detection of the external RI depending on
the geometry of a side-hole optical fibre microcavity was
investigated. For a microcavity length of 35 μm, the
preliminary results obtained indicate no dependence of
transmission spectra on the external RI in two ranges of 1.30–1.45 and 1.49–1.57. Two constants levels of optical power can be distinguished, except for fluctuations in one of the samples after applying an immersion liquid with an RI of 1.32. A high dependence on the optical power level is visible in a very narrow range of RI changes (approxi-mately 0.03), with a sensitivity of around 150 dB/RIU. This is linked to the fact that if the external RI is higher than the RI of the fibre, there is a leakage of cladding modes beyond its area. For the microcavity with a cut length of approximately 60 μm, characteristic wavelength dips are observed, suggesting the presence of resonant modes inside the cavity. The decrease in RSR values with increasing external RI suggests a linear relationship between the two parameters. Based on the gathered results, it is possible to fabricate a sensor for an external RI by performing laser micromachining of the S‑H OF cladding with access to one of the air holes. The results for the microcavity with a length of approximately 35 μm suggest the possibility of RI detection based on the transmitted power level, although for the narrow range of 1.46–1.49. The analysis of results for the 60 μm microcavity suggests a sensing potential based on RSR readings for RI (1.464–1.557). This micro-cavity geometry demonstrated a sensitivity of approximately ~ 2621 nm/RIU. Based on the obtained results, it can be concluded that the sensor reported in the authors’ study can be used for further research focused specifically on the detection of chemical and biological factors. Since the study used a supercontinuum light source, which is unpolarized, polarization control of the input beam was not conducted. The research results, supplemented by such an analysis, will be the subject of future studies.
Authors’ statement
Research concept and design, R.K. and M.D.; collection and/or assembly of data, R.K. and M.D; data analysis and interpretation, R.K. and M.D.; writing the article, R.K., T.O., and M.Z.; critical revision of the article, L.R.J. and M.D.; final approval of the article, L.R.J.
Acknowledgements
This research was financially supported by the Military University of Technology under research project UGB. The S-H OF used in the research was kindly provided by the Laboratory of Optical Fibers Technology at Maria Curie-Skłodowska University in Lublin, Poland.
References
Niewczas, M. et al. Technology and research on the influence of liquid crystal cladding doped with magnetic Fe3O4 nanoparticles on light propagation in an optical taper sensor. Adv. Opt. Technol. 13, 1422695 (2024). https://doi.org/10.3389/aot.2024.1422695
Bao, Y., Valipour, M., Meng, W., Khayat, K. H. & Chen, G. Distributed fiber optic sensor-enhanced detection and prediction of shrinkage-induced delamination of ultra-high-performance concrete overlay. Smart Mater. Struct. 26, 085009 (2017). https://doi.org/10.1088/1361-665X/aa71f4
Pisco, M. & Cusano, A. Lab-on-fiber technology: A roadmap toward multifunctional plug and play platforms. Sensors 20, 4705 (2020). https://doi.org/10.3390/s20174705
Abouraddy, A. et al. Towards multimaterial multifunctional fibres that see, hear, sense, and communicate. Nat. Mater. 6, 336–347 (2007). https://doi.org/10.1038/nmat1889
Stasiewicz, K. A., Jakubowska, I., Moś, J., Kosturek, R. & Kowiorski, K. In-line gas sensor based on the optical fiber taper technology with a graphene oxide layer. Electronics 12, 830 (2023). https://doi.org/10.3390/electronics12040830
Pura, P. et al. Polymer microtips at different types of optical fibers as functional elements for sensing applications. J. Light. Technol. 33, 2398–2404 (2015). https://doi.org/10.1109/JLT.2014.2385961
Gasior, K., Martynkien, T., Wojcik, G., Mergo, P. & Urbanczyk, W. D-shape polymer optical fibres for surface plasmon resonance sensing. Opto-Electron. Rev. 24, 209–215 (2017). https://doi.org/10.1016/j.opelre.2017.01.003
Stepniewski, G. et al. From D-shaped to D-shape optical fiber – A universal solution for sensing and biosensing applications: Drawn D-shape fiber and its sensing applications. Measurement 222, 113642 (2023). https://doi.org/10.1016/j.measurement.2023.113642
Wang, Q. et al. Curvature sensor based on D-shape fiber long period fiber grating inscribed and polished by CO2 laser. Measurement 223, 113665 (2023). https://doi.org/10.1016/j.measurement.2023.113665
Pallarés-Aldeiturriaga, D., Roldán-Varona, P., Rodríguez-Cobo, L. & López-Higuera, J. M. Optical fibre sensors by direct laser processing: A review. Sensors 20, 6971 (2020). https://doi.org/10.3390/s20236971
Meunier, D. et al. Controlled-chemical etching of the cladding in optical fibers for the design of analytical sensors. Opt. Fiber Technol. 78, 103328 (2023). https://doi.org/10.1016/j.yofte.2023.103328
Mahmud, N. N. H. E. N. et al. Optical trapping using mode-locked fiber laser Au-NP coated side-polished fiber. Sens. Actuators A Phys. 368, 115167 (2024). https://doi.org/10.1016/j.sna.2024.115167
Teng, C. et al. Double-side polished U-shape plastic optical fiber based SPR sensor for the simultaneous measurement of refractive index and temperature. Opt. Commun. 525, 128844 (2022). https://doi.org/10.1016/j.optcom.2022.128844
Kim, Y.-C., Wei, P., Banerji, S. & Booksh, K. S. Tapered fiber optic surface plasmon resonance sensor for analyses of vapor and liquid phases. Opt. Lett. 30, 2218–2220 (2005). https://doi.org/10.1364/OL.30.002218
Stasiewicz, K. A., Jakubowska, I. & Dudek, M. Detection of organosulfur and organophosphorus compounds using a hexafluorobutyl acrylate-coated tapered optical fibers. Polymers 14, 612 (2022). https://doi.org/10.3390/polym14030612
Zhang, Z., Gong, H., Yu, C., Ni, K. & Zhao, C. An optical fiber humidity sensor based on femtosecond laser micromachining Fabry- Perot cavity with composite film. Opt. Laser Technol. 150, 107949 (2022). https://doi.org/10.1016/j.optlastec.2022.107949
Ran, Z., Rao, Z., Zhang, J., Liu, Z. & Xu, B. A miniature fiber-optic refractive-index sensor based on laser-machined Fabry–Perot interferometer tip. J. Light. Technol. 27, 5426–5429 (2009). https://doi.org/10.1109/JLT.2009.2031656
Wang, H. et al. Miniature fiber-optic near-surface gap-coupled cladding waveguide Mach-Zehnder interferometric refractive index sensor inscribed by femtosecond laser. Opt. Laser Technol. 16, 109649 (2023). https://doi.org/10.1016/j.optlastec.2023.109649
Zhao, Y., Zhao, J., Wang, X.-X., Peng Y. & Hu, X.-G. Femtosecond laser-inscribed fiber-optic sensor for seawater salinity and temperature measurements. Sens. Actuators B Chem. 353, 131134 (2022). https://doi.org/10.1016/j.snb.2021.131134
García, J. A., Monzón-Hernández, D., Manríquez, J. & Bustos, E. One step method to attach gold nanoparticles onto the surface of an optical fiber used for refractive index sensing. Opt. Mater. 51, 208– 212 (2016). https://doi.org/10.1016/j.optmat.2015.11.038
Liu, P. Y. et al. Cell refractive index for cell biology and disease diagnosis: Past, present and future. Lab Chip 16, 634–644 (2016). https://doi.org/10.1039/C5LC01445J
Leal-Junior, A. G. et al. Polymer optical fiber sensors in healthcare applications: A comprehensive review. Sensors 19, 3156 (2019). https://doi.org/10.3390/s19143156
Joe, H.-E., Yun, H., Jo, S.-H., Jun, M. B. G. & Min, B.-K. A review on optical fiber sensors for environmental monitoring. Int. J. Pr. Eng. Man-GT. 5, 173–191 (2018). https://doi.org/10.1007/s40684-018-0017-6
Weng, S., Pei, L., Wang, J., Ning, T. & Li, J. High sensitivity side- hole fiber magnetic field sensor based on surface plasmon resonance. Chin. Opt. Lett. 14, 110603, (2016). https://doi.org/10.3788/COL201614.110603
Frazão, O. F. et al. Optical refractometer based on a birefringent Bragg grating written in an H-shaped fiber. Opt. Lett. 34, 76–78 (2009). https://doi.org/10.1364/OL.34.000076
Erdmanis, M. et al. Comprehensive numerical analysis of a surface- plasmon-resonance sensor based on an H-shaped optical fiber. Opt. Express 19, 13980–13988, (2011). https://doi.org/10.1364/OE.19.013980
Lin, H., Liu, F., Guo, H., Zhou, A. & Dai, Y. Ultra-highly sensitive gas pressure sensor based on dual side-hole fiber interferometers with Vernier effect. Opt. Express 26, 28763–28772 (2018). https://doi.org/10.1364/OE.26.028763
Dudek, M. & Köllö, K. K. Numerical simulations of a simple refractive index sensor based on side-hole optical fibres. Opto-Electron. Rev. 30, e143607 (2022). https://doi.org/10.24425/opelre.2022.143607
Wei, T., Han, Y., Li, Y., Tsai, H. L. &. Xiao, H. Temperature- insensitive miniaturized fiber inline Fabry-Perot interferometer for highly sensitive refractive index measurement. Opt. Express 16, 5764–5769 (2008). https://doi.org/10.1364/OE.16.005764
Wang, J., Zhao, J., Wang, J., Wan, H. & Zhang, Z. A multi- frequency fiber optic acoustic sensor based on graphene-oxide Fabry-Perot microcavity. Opt. Fiber Technol. 65, 102607 (2021). https://doi.org/10.1016/j.yofte.2021.102607
Rostamikafaki, Z. Optimization of the performance of biosensor based on photonic crystal resonant. Univers. J. Electr. Electron. Eng. 6, 203–213 (2013). https://doi.org.10.13189/ujeee.2019.060403
Tien, C.-L., Lin, H.-Y. & Su, S.-H. High sensitivity refractive index sensor by D-shaped fibers and titanium dioxide nanofilm. Adv. Condens. Matter Phys. 2018, 2303740 (2018). https://doi.org/10.1155/2018/2303740
Liu, Y., Qu, S. & Li, Y. Liquid refractive index sensor with three- cascades microchannels in single-mode fiber fabricated by femtosecond laser-induced water breakdown. Appl. Phys. B-LasersO. 110, 585589 (2013). https://doi.org/10.1007/s00340-012-5296-y
Xue, P., Zhang, Y., Xu, T. & Liu, X. Sensing characteristics of the F-P cavity on the tip of a microstructured fiber. Opt. Fiber Technol. 82, 103647 (2024). https://doi.org/10.1016/j.yofte.2023.103647