This paper presents a novel polarisation-optical method for the automated inspection of surface defects in railway rails. The proposed approach is based on the detection of changes in the polarisation state of reflected laser radiation, caused by local anomalies such as cracks, residual stress zones, and surface contamination. A differential signal is generated by separating orthogonal polarisation components using a polarising beam splitter, enabling high sensitivity to surface irregularities while suppressing common-mode noise. To improve the interpretability of the acquired signal, a multi-stage digital processing pipeline is employed. It includes moving average and Gaussian filtering, threshold-based segmentation, and frequency-domain analysis using both discrete Fourier and continuous wavelet transforms. The method was validated through a set of simulated signals, imitating typical rail defects in noisy conditions. The results demonstrate reliable detection and localisation of structural anomalies, with a clear distinction between sharp discontinuities and wide modulations caused by tension. Due to its compatibility with automated processing frameworks, the method is well suited for integration with modern diagnostic platforms, including mobile rail inspection systems. This makes it a promising candidate for predictive maintenance strategies and digital transformation of railway infrastructure monitoring.
Introduction
Railway transport plays a critical role in the infrastructure of modern society, supporting both economic development and population mobility. With the increase in train speed and the growth of traffic loads on the railway network, the requirements for operational safety and reliability are becoming more stringent. Among the most crucial safety-related components are railway tracks, where the surface-initiated rolling-contact-fatigue (RCF) defects have a direct impact on the risk of train derailments, economic losses, and environmental damage.
Conventional rail-inspection techniques target a specific defect class, ultrasonics for internal flaws, magnetic-particle procedures for surface-breaking discontinuities, eddy-current probes for near-surface cracks, but none of them simultaneously achieves the sensitivity, network-scale coverage, and fully autonomous operation required by today’s high-throughput maintenance regimes. These limitations are particularly noticeable when detecting small-scale surface defects or localised zones of residual stress, which can serve as early indicators of fatigue or structural degradation.
In this context, the development of highly sensitive, automated, and digitally integrated inspection methods is a key challenge.
This study presents a novel automated polarisation-optical method for detecting and analysing surface defects in railway rails. The method combines polarimetric sensing with advanced digital signal processing, including differ-ential signal analysis and wavelet-based time–frequency decomposition, to enhance sensitivity and reliability in practical conditions. By exploiting changes in the state of polarisation of a reflected laser beam, the proposed system provides precise defect localisation and full compatibility with automated data processing lines.
Current state of non-destructive testing of railway rails
Modern non-destructive testing (NDT) of railway rails includes a wide range of methods, among which the most common remain visual, ultrasonic, magnetic particle and eddy-current testing. In parallel, modern diagnostic platforms increasingly include automated optical systems, as well as artificial intelligence (AI) and deep learning algorithms, which significantly expand their capabilities and autonomy.
A total track inspection (TTI) concept was proposed in [1] as a comprehensive approach to monitoring railway infrastructure by integrating both traditional and advanced methods. This methodology combines automated visual surveys, inertial sensors, and geophysical scanners, which allow not only the identification of damage but also the investigation of its origin and evolution. This integration is the basis of predictive maintenance systems. A systematic review in [2] highlights the importance of combining visual methods, vibration diagnostics, ultrasonic inspection, and modern optical sensors within embedded monitoring systems. Similarly, the role of combining traditional and intelligent techniques to improve the reliability of railway infrastructure and implement predictive maintenance is emphasized in [3]. The integration of wireless sensor networks with defect detection systems further facilitates early anomaly detection and real-time data collection. Ultrasonic inspection, as defined by ISO 2024 [4], remains one of the most widespread NDT techniques. It operates on the principle of detecting the reflection of ultrasonic waves at the internal material boundaries, making it suitable for detecting defects such as cracks, inclusions, and delamination.
As shown in [5], this method is effective for subsurface inspection, although its sensitivity to fine surface-level defects remains limited, particularly when the surface is contaminated, corroded, or rough. Recent developments include the application of digital signal processing and AI to enhance classification accuracy and noise suppression [6]. Complementing traditional inspection methods, new optical technologies are becoming increasingly important. One example is distributed acoustic sensing (DAS), where standard fibre-optic cables detect acoustic vibrations and transform a fibre into an array of passive sensors [7]. These systems can detect the position, type, and speed of a train with high accuracy.
In the field of AI-based inspection, a real-time detection of surface defects has been proposed using improved YOLOv4 models [8]. Meanwhile, synthetic defect image generation by ACGAN has been shown to enhance model training and robustness [9]. Laser scanning also plays an important role. 3D profilometry systems based on laser triangulation or structured light allow a precise topographic mapping of rail surfaces and are particularly effective for detecting surface wear, cracks, and corrosion [10].
Magnetic particle inspection (MPI), defined by ASTM E709-15 [11], is a widely used technique for detecting surface-breaking cracks. It involves applying magnetic particles to a magnetized surface where particles cluster at the locations of flux leakage. Although effective, this method requires clean surfaces and relies on manual interpretation.
Eddy-current testing (ECT), as specified in ISO 15548‑1 [12], enables the non-contact identification of surface and near-surface defects by detecting variations in induced electromagnetic fields. Its effectiveness, however, depends mainly on the design of the sensor and surface-initiated RCF defects. Among optical methods, digital imaging, laser triangulation, and structured light scanning provide high-speed and high-resolution inspection. However, these technologies can be sensitive to ambient light, surface reflectivity, and contamination [13].
Hybrid solutions are also under development. A magnetic train monitoring system that integrates optical and electromagnetic sensing has been proposed in [14], demonstrating high accuracy and reliability in contami-nated surface-initiated RCF defects. Such solutions are promising for adaptation to conventional rail networks.
Multi-sensor systems are gaining popularity. An integrated diagnostic platform that combines ultrasonic, eddy-current, laser, and thermographic inspections is described in [15]. This approach enables cross-validation and comprehensive assessment of railway conditions, particularly in high-speed and complex terrain environments.
Recent academic research also reflects these trends. Wavelet transform methods for accurate rail edge localisation in visual diagnostics are investigated in [16]. Acoustic coupling in ultrasonic probes for high-speed rail inspection is modelled in [17] and a residual magnetic field system for early defect detection is evaluated in [18].
In summary, although a wide range of inspection techniques – from conventional NDT to advanced AI‑assisted optical methods – exists, many of them still struggle to detect small surface-level defects, especially in high-speed operating conditions.
However, optical control methods based on polarisation remain significantly underrepresented in the literature on non-destructive testing of railway rails. This is despite experimental evidence from other metallic surfaces indicating that polarisation-differentiated reflection can significantly enhance the visibility of micro-scale flaws such as micro-cracks and corrosion.
Recent studies have demonstrated that a differential analysis of the reflectance of s- and p-polarised light can detect surface defects on metallic substrates. For example, Wang et al. [19] demonstrated that polarisation-resolved imaging significantly suppresses glare and sensor noise on highly reflective metal surfaces, thereby improving the image uniformity and facilitating the automatic detection of cracks and other minor defects. These results confirm the effectiveness of polarisation optics as a non-invasive method for inspecting the surface quality of metallic components.
Kou et al. [20] developed a crack detection scheme for rail surfaces based on semantic image segmentation. The authors created a dataset of 380 real crack images obtained under various operating conditions and trained a DeepLabv3+ network with a ResNet‑50 for automatic defect localisation. The model achieved an overall detec-tion accuracy of 96.4 %, making it a viable alternative to traditional magnetic particle testing. Comparative tests demonstrated that experienced inspectors could identify the same cracks in both magnetic particle and regular camera images, although with lower optical contrast in the latter, thereby confirming the practical effectiveness of vision-based rail-surface diagnostics.
The authors compiled a dataset consisting of 380 real crack images obtained under various operating conditions and trained a DeepLabv3+ network with a ResNet-50 backbone for automatic defect localisation. The model achieved an overall detection accuracy of 96.4%, making it a viable alternative to traditional magnetic particle testing. Comparative tests demonstrated that experienced inspec-tors could identify the same cracks in both magnetic particle images and regular camera images, albeit with lower optical contrast in the latter, thereby confirming the practical effectiveness of vision-based rail-surface diagnostics.
Lian et al. [21] introduced a laser‑ultrasonic testing (LUT) procedure for a quantitative assessment of shallow surface cracks in railway rails. The approach integrates a variational mode decomposition (VMD) with a time-of-flight (TOF) analysis of Rayleigh waves at the crack locations compared to intact regions. Rail samples containing artificial cracks of varying depths, orientations, and widths were examined experimentally. The recorded ultrasonic waveforms exhibited distinct diffracted‑wave echoes from the cracked areas relative to intact samples. VMD filtering enhanced the signal‑to‑noise ratio and isolated the target surface‑wave mode, enabling more a reliable feature extraction. The combined VMD-TOF processing produced crack-dimension estimates with an error of less than 10%, highlighting the effectiveness of LUT augmented by advanced signal-processing techniques for rail-defect detection.
Xu et al. [22] reported a differential ECT system designed for crack detection in rails under high-speed inspection conditions. The experimental setup simulated lift-off distances between the sensor and the rail surface ranging from 1 to 6 mm and scanning speeds from 20 to 300 km/h. Representative oscillograms and corresponding spectra were presented for various crack depths and scanning speeds. The results showed that the defect-induced signal frequency is governed by a probe coil diameter and scanning speed, while the signal amplitude decreases linearly with increasing inspection speed. The slope of this linear attenuation correlates with crack depth, enabling depth estimation through in-motion amplitude measurements. These findings confirm that differential signal processing improves noise immunity and confirm the feasibility of high-speed ECT for rail inspection without compromising sensitivity.
Meyer et al. [23] proposed a novel optical strategy for rail‑surface crack detection based on digital image correlation (DIC). Rather than directly identifying crack pixels, the method measures the minute deformation fields generated by crack‑induced bending. In laboratory tests, rail sections were loaded to simulate realistic bending, resulting in localised strain concentrations at crack sites. A stereo camera DIC system recorded micro‑strain maps on the rail‑head surface, enabling crack identification before any visual indications appeared. The measured strain patterns corresponded to the actual crack network confirmed by microscopic inspection, while numerical simulations demonstrated high sensitivity to crack depth. Unlike ultrasonic or eddy-current techniques, which provide only indicative damage metrics, the DIC approach delivers spatially resolved mapping of surface crack networks, along with depth estimation, highlighting its value for structural health monitoring of rails.
In a recent study, Wang and Wu [19] introduced an efficient defect‑detection scheme for highly reflective, strongly curved metallic surfaces by combining polarisation imaging with an enhanced YOLOv11 network. The inspection system uses polarisation filters in front of the camera to suppress specular glare when examining curved steel components, such as the rail head. Polarisation capture markedly reduces over‑exposure and sensor noise, improving image homogeneity and thereby facilitating automated recognition of cracks and other fine defects. The paper presents visual comparisons of defect images, such as pitting corrosion, micro‑cracks, scratches captured before and after polarisation filtering, along with quantitative graphs showing reduced root mean square noise and improved brightness uniformity. For training and testing the YOLOv11 model, a large dataset of 1.536 defect images was compiled, captured from various viewing angles on curved samples. The polarisation-aware network achieved high detection accuracy, confirming the utility of polarisation optics for non-invasive quality inspection of metallic components and highlighting its potential for rail-surface diagnostics.
Justification for measuring orthogonal polarisation components as indicators of surface defects
When illuminating a defect-free, smooth metallic surface, its reflectance coefficients for s‑ and p-polarised light (Rs and Rp) remain essentially constant. Although the difference between Rs and Rp is typically small for metals – unlike for dielectrics – a measurable contrast can be achieved by setting the incidence angle α close to the so‑called pseudo‑Brewster angle, where Rp reaches a shallow minimum (even strongly absorbing metals still exhibit Rp > 10% at this point [24, 25]). By tuning the beam to this optimal angle and providing a linearly polarised input at 45° to the plane of incidence, the reflected intensities from a clean surface become nearly balanced (Is ≈ Ip). Consequently, the differential signal ΔI = Is − Ip is nominally zero in the absence of defects and any slight disturbance introduced by surface defects manifests as a pronounced deviation. This configuration represents a polarimetric inspection scheme akin to a simplified ellipsometry setup, where changes in the amplitude ratio and phase shift between the s- and p-channels sensitively track microscale alterations of the surface optical properties [26–31].
Another advantage of differential measuring of Is and Ip is the intrinsic suppression of common‑mode fluctuations arising from the light source or the optical path. Any global change in laser power or large‑scale attenuation affects both polarisation channels equally and is effectively cancelled in the differential signal. This principle – widely used in atomic magnetometers and other high‑sensitivity sensors – mitigates source drifts and background noise by simultaneously analysing two orthogonal polarisation components [32, 33].
The method is inherently sensitive to small surface anomalies. Admittedly, as the defect size decreases, the intensity of scattered light drops sharply; however, by focusing the laser beam on a small spot and performing slow, data‑averaged scans, sub‑micron defects can still be resolved. Practical experience in laser scatterometry demonstrates that surface defects on the order of 0.1 μm can be identified on high‑grade optical substrates [34].
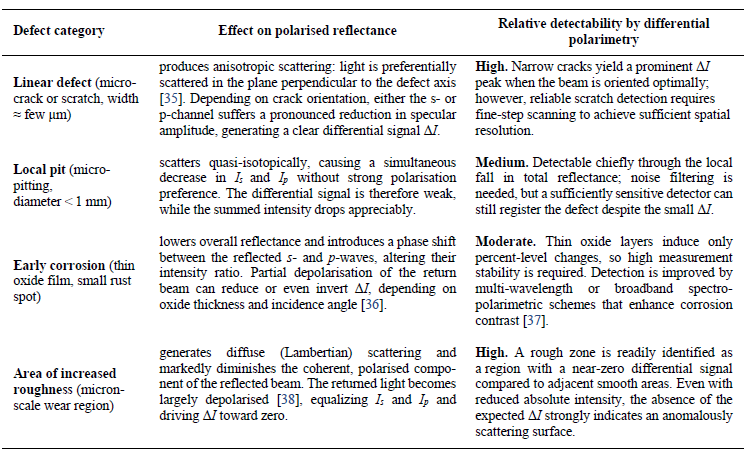
The geometry and orientation of a surface defect modu-late the measured signal in the manner presented in Table 1 Linear defects – namely micro‑cracks and surface scratches – generate strongly anisotropic scattering. A narrow crack behaves like a slit that radiates most of its scattered light in a direction normal to its long axis. When the plane of laser incidence (and thus the p‑polarisation axis) is perpendicular to the crack, scattering within that plane is maximised [37]; one of the polarisation channels (either s or p) experiences a noticeable reduction in specular intensity as energy is diverted into the scattered field. Conversely, if the crack is aligned parallel to the plane of incidence, in‑plane scattering is minimised [35] and the defect produces a weaker polarimetric signature. Sensitivity to micro‑cracks is therefore highly orientation‑dependent, implying that multiple inspection passes at different incidence azimuths – or two mutually orthogonal laser beams – may be required to ensure comprehensive detection. Surface scratches, which disrupt the rail-head continuity to a lesser degree, follow the same anisotropic scattering behaviour but yield lower signal amplitudes. Nevertheless, polarisation‑resolved optical scanning has been shown to reveal even outstanding scratches on polished substrates [39], attesting to the method sufficient sensitivity to narrow linear defects.
Point‑like or nearly circular imperfections – such as micro‑pits, localised pitting corrosion, or small cavities – tend to scatter the incident light quasi‑isotropically. Consequently, they chiefly reduce the total reflected intensity directed towards the detector, while introducing only a minor polarisation asymmetry owing to their near‑isotropic geometry.
The differential signal, ΔI = Is − Ip, generated by a small round pit, therefore remains comparatively low; the principal signature is a synchronous decrease in both Is and Ip. Nonetheless, such defects are still detectable via the local drop in the total reflected intensity. A system that records both ΔI and the total intensity (e.g., through electronic summation of the two polarisation channels) achieves a higher overall probability of defect recognition.
micro-defect on the polarised reflectance and ranks their relative detectability using the differential polarimetric method. As indicated in Table 1, the differential polarimetric scheme is particularly sensitive to linear defects, such as cracks, as well as to pronounced variations in surface micro‑topography. In contrast, isotropic point‑like pits and thin oxide films generate a weaker polarisation contrast; nevertheless, they remain detectable through a concurrent drop in total reflectance or subtle shifts in the Is/Ip ratio. Since crack orientation is critical, the laser beam should be directed from multiple azimuthal angles – for example, by scanning the rail twice from opposite sides or at two orthogonal angles of incidence – to avoid missing defects aligned unfavourably in a single pass. In this way, mutually orthogonal micro‑cracks are captured in at least one inspection pass.
The effects of different categories of micro-defects on polarised reflectance and their relative detectability were examined by using the differential polarimetric method.
Polarisation-optical methods of surface inspection have been proven effective in numerous studies [26–30]. Although there are few publications devoted specifically for rails, there are similar examples.
In the semiconductor industry, polarisation separation of reflected light is used for a substrate-surface inspection. Patented systems scan the wafer with a laser (typically 632.8 nm) at a grazing angle and record Is and Ip separately to detect small scratches and dots on the surface [40]. Such devices can automatically identify defects of the order of a few micro-meters or smaller on mirror surfaces. This example confirms that the fundamental principle of separating orthogonal reflection polarisations and analysing the difference effectively enables high-precision surface-defect detection.
A system has been reported that employs a polarisation camera to capture images of micro-scratches and inclusions on optical components, contrast levels that are unattainable under conventional illumination [41]. In one study, this approach achieved a 95.9% probability of detecting and classifying surface defects by type [42]. Although the context is different (optical components), the underlying physical principles are the same: surface defects alter the polarisation state of reflected light, which is captured by a sensitive detector [43].
There are few direct publications on the use of polarised reflection for rail inspection. However, some studies report the application of magneto-optical imaging for detecting rail defects based on the Faraday effect, which also involves polarised light, but in combination with a magnetic field to detect subsurface cracks [42]. This indirectly supports the idea that polarisation is an informative parameter for analysing the state of metallic surfaces.
It should be noted that applying such optical scanning to real railroad tracks must account for external factors such as dirt, oil, and moisture. A thick contamination layer can obscure defects or produce a false signal on its own. For example, a film of grease can act as a thin optical film, changing polarisation, similar to the effect of corrosion. Therefore, in the field, the method is most effective when combined with a cleaning mechanism (such as air jet, brush before the laser) or when applied to rails that have been descaled.
Studies have shown that polarisation-resolved imaging enhances the visibility of corrosion beneath paint layers [37], suggesting that the effect is even more noticeable when the surface is uncoated. As a result, the system can detect early-stage corrosion as a region where the polarisation difference is reduced (closer to zero than the neighbouring non-oxidized areas). If corrosion detection is the primary goal, it may be advantageous to supplement the system with a second laser in the near-infrared (e.g., 980 nm). Oxide films often have a stronger influence on IR reflection, and comparing signals at 633 nm and 980 nm enables corrosion identification through dual-spectral polarimetry. However, even with a single laser, a statistical increase in signal scatter in the corroded area can be recorded.
The rail surface also changes roughness due to various factors, such as wheel slip (rolling contact fatigue, corrugation), grinding during repair, and wear. The polarisation method is extremely sensitive to surface roughness, because perfectly smooth steel retains the polarisation of reflection, while rough steel depolarises it [38]. Therefore, any area with increased roughness appears “dark” in the differential channel (low ΔI signal). Even without precise calibration, it is possible to distinguish rail sections: polished zones from wheel contact (glossy) will show one signal level, while matte regions (due to corrosion or abrasion) will show another. This makes the system additionally valuable as a surface condition sensor (smoothness/roughness). For example, a gradual decrease in ΔI along the rail may indicate increasing roughness – a criterion for the onset of wear or poor quality rolling. And local “bursts” of the zero differential signal may indicate scale or dirt build-up.
Experimental setup and measurement methodology
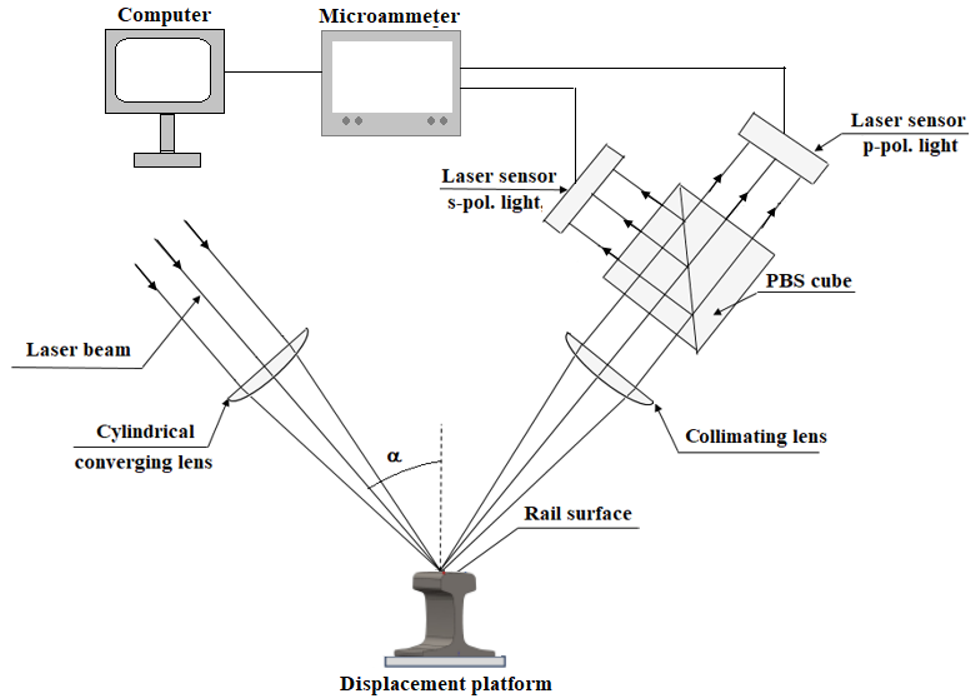
The proposed polarisation-optical method for detecting surface defects of railway rails was implemented on a specially designed experimental setup, schematically presented in Fig. 1.
Fig. 1.Experimental setup for polarisation-based surface-defect inspection of railway rails. The laser beam is focused onto the rail surface using a cylindrical converging lens. The reflected beam is collimated and separated by a polarising beam splitter (PBS) cube into s- and p‑polarised components, which are then recorded by dedicated sensors. The angle α defines the incidence geometry of the system.
Description of the optical scheme
The experimental system consists of the following major components:
Laser beam: a linearly s-polarised laser beam is used to maximise sensitivity to rail surface irregularities.
Cylindrical converging lens: this element focuses the incoming beam into a narrow line on the rail surface without disturbing its s-polarisation
Rail surface: the object under investigation, reflective properties of which vary depending on the presence of surface defects.
Cylindrical collimating lens: collects the reflected beam and forms a collimated optical path for subsequent polarisation separation
PBS: this element splits the reflected light into orthogonal linear polarisation components – the PBS reflects the s-polarised component, while the p-polarised component is transmitted.
Laser sensors: two photodetectors are positioned to capture separated s- and p-polarised beams, converting optical signals into electrical signals for analysis.
Measurement procedure
The measurement process includes the following stages:
System calibration: an initial calibration is carried out on a reference section of the rail without visible defects. Baseline values of the polarisation component intensi-ties Ip0 and Is0 are recorded.
Surface scanning: either the laser beam is scanned along the rail surface, or the rail is moved under a fixed optical path at a constant speed, ensuring uniform coverage.
Signal acquisition: for each scanning point, the intensity of the s- and p-polarised components Is(x) and Ip(x) are registered using the corresponding sensors. The obtained values of the orthogonal polarisation components are normalised to their maximum value.
Differential signal formation: a difference signal is calculated in real-time:
\(
\Delta I(x)=I_s(x)-I_p(x)
\) (1)
This signal increases sensitivity to defects while suppressing noise and fluctuations from the laser source.
Digital signal processing: the resulting signal ΔI(x) is digitally filtered (e.g., moving average, Gaussian filter), after which time-frequency analysis methods such as wavelet transform are applied to localise defects accurately.
Defect mapping and classification: defect maps are generated based on the processed signals. These maps not only facilitate localisation but also classification of surface anomalies, such as microcracks, larger cracks, or localised stress zones.
Experimental laboratory investigations
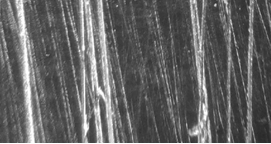
Experimental laboratory investigations were conducted on the metallic surface depicted in Fig. 2.
The metallic layer was fabricated by depositing alu-minium onto a glass substrate. In the defect-free regions, the surface exhibits specular reflection of the laser beam, whereas in areas containing surface defects, partial scattering of the reflected beam is observed. The width of an individual scratch-defect is about 1 μm, and the depth is about 0.3 μm.
A 5 mW laser (λ = 632.8 nm) was expanded and focused by a cylindrical converging lens to produce a 3 mm × 500 μm spot on the investigated surface. The beam impinged at an incidence angle α = 60°, close to the pseudo-Brewster angle for aluminium. The reflected light was collimated and separated into s- and p-components by a PBS cube; each component was detected by a silicon photodiode fitted with a narrowband interference filter to suppress ambient light. The sample consisted of a glass slide coated with a ~ 20 μm aluminium mirror. A defect zone, 3 mm long, was produced by manually scribing parallel scratches perpendicular to the scan direction. The mirror was mounted on a motorised translation stage and scanned in 0.5 mm steps over a 12 mm path that encompassed the scratched region. For each scan step, the paired detector readings were averaged to reduce shot noise; the resulting traces were then normalised to the maximum signal in their respective channels, thereby compensating for the inherent 1:100 intensity ratio between the p- and s-polarised reflections from a pristine aluminium surface.
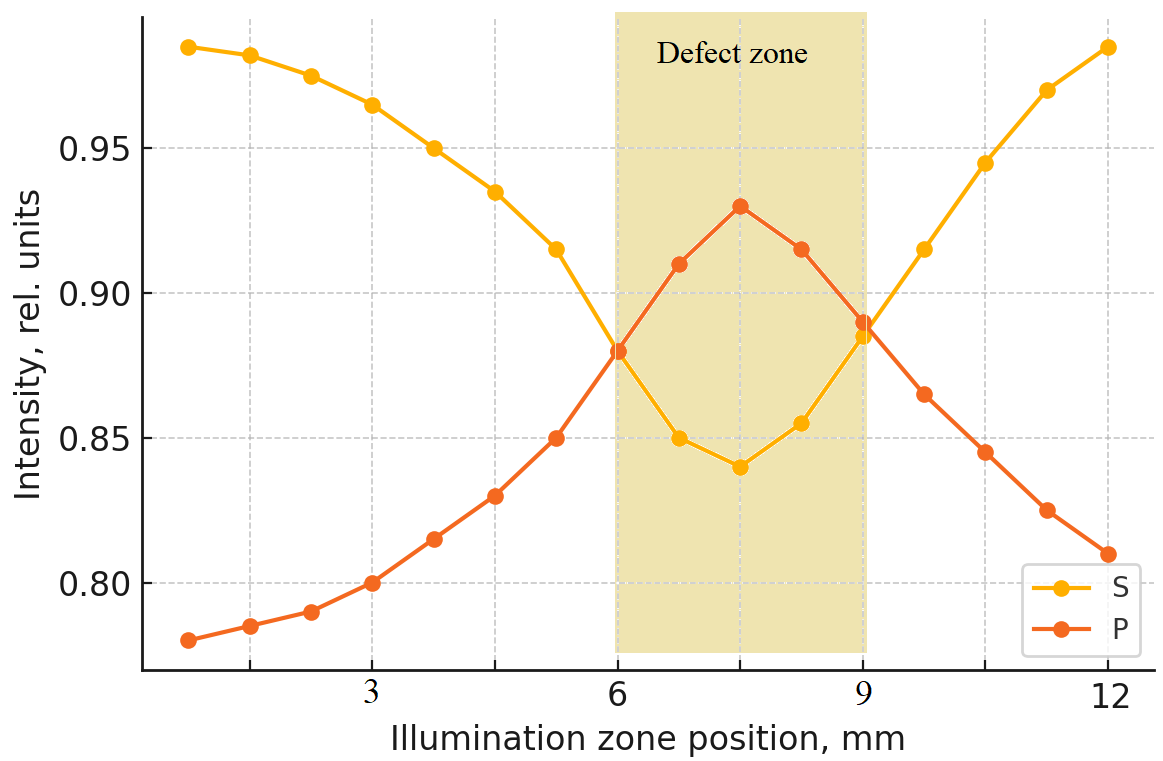
Fig. 3 presents the normalised reflectance profiles Is(x) and Ip(x). Outside the defect zone (positions 1–6 and 9–12), both curves remain within ± 2% of their mean values, confirming system stability. Within the scratched region (positions 6–9), Ip ≈ 10%, whereas Is drops by ≈ 15%, producing a clear crossover.
Fig. 3.Intensity of s-and p-components reflected from the
investigated metallic surface vs. illumination zone
position.
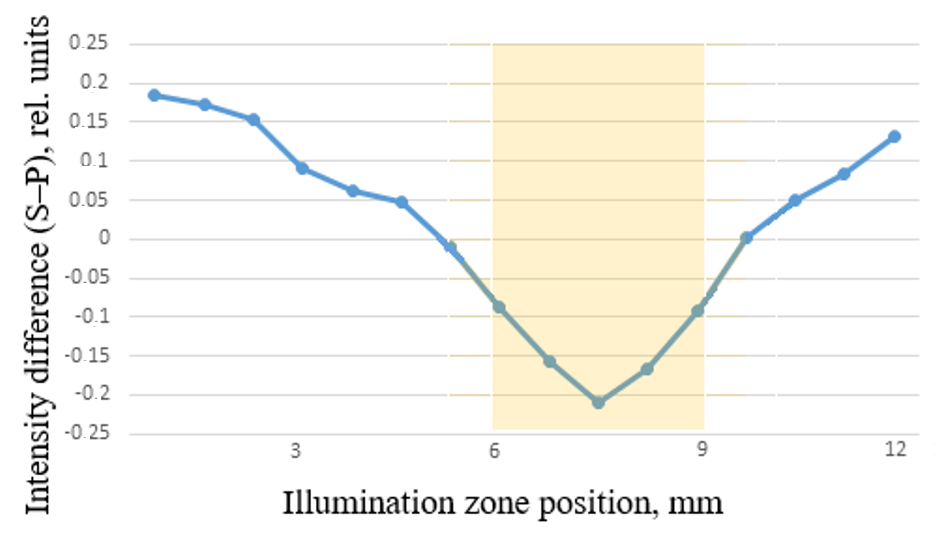
The differential curve ΔI = Is – Ip (Fig. 4) emphasises this behaviour: ΔI is centred near zero over undamaged areas and attains a minimum of −0.23 (≈ −25% of full scale) at the defect centre. The shaded band in Fig. 4 delineates the scratch interval, illustrating that the differential metric isolates the damaged region with high contrast despite the absolute signals being normalised separately.
Fig. 4.Difference in reflection intensities (S–P) from the
investigated aluminium surface vs. illumination zone
position.
Advantages of the proposed method
The proposed configuration and methodology have several innovative advantages:
The use of a PBS cube enables precise separation of polarisation components with high-signal stability.
The differential signal ΔI significantly increases sensitivity to subtle surface defects.
Advanced signal processing techniques (digital filtering, wavelet analysis) increase the system reliabil-ity under realistic conditions including mechanical vibrations, contamination, and laser instability.
The entire methodology can be implemented in an automated mode, meeting modern requirements for the digitalisation and automation of non-destructive testing of railway infrastructure.
The described process of signal acquisition forms the basis for further theoretical modelling and analysis, which is discussed in the next section.
To provide a deeper understanding of the signal formation mechanism and its relationship with surface defects, the authors proceed to a theoretical consideration of the polarisation-optical interaction involved in the presented system.
Theoretical foundation of polarisation-optical inspection
Electromagnetic interaction of polarised optical beam with metallic surface
The principle of operation of the proposed testing method is based on the interaction between linearly polarised electromagnetic radiation and microstructure metal surface of a railway rail. When s-polarised light (with the electric field vector perpendicular to the plane of incidence) strikes the surface, part of it is reflected. The amplitude and phase of the reflected wave depend on local surface conditions.
The reflected electric field can be expressed as:
where Er(x) is the reflected field amplitude at position x,
rest(x) is the local Fresnel reflection coefficient for s-polarised light, ϕ(x) is the phase shift caused by local variations of height, refractive index, or stress, E0 is the incident field amplitude.
The reflection coefficient rs depends on the angle of incidence and the complex refractive index of the material [44, 45]. For smooth metallic surfaces, it can be approxi-mated by the Fresnel formula [44, 45]:
where n1, n2 are the refractive indices of the air and metal (where n2 is complex), θi is the angle of incidence, θt is the angle of refraction (according to the Snell’s law).
In practice, the incidence angle θi = α ≈ 45° was selected as a compromise that ensures sufficient reflected intensity while maintaining sensitivity to polarisation changes. This angle also simplifies optical alignment and matches the focusing characteristics of a cylindrical lens.
Polarisation-dependent signal formation and defect sensitivity
The beam reflected from the rail surface contains both s- and p-polarised components due to polarisation changes caused by surface features. The PBS separates these ortho-gonal components in space:
s-polarised light is reflected from the PBS,
p-polarised light is transmitted.
These components are independently detected and used to form a differential signal:
\(
\Delta I(x)=I_s(x)-I_p(x)
\) (4)
This approach improves sensitivity to defects that alter surface reflectivity, micro-roughness, or stress-induced birefringence. Different types of defects cause specific changes in the polarisation state:
Micro-cracks: local phase and amplitude discontinuities; generate high spatial-frequency content.
Deep cracks: cause polarisation rotation due to scattering and angular divergence.
Corrosion pits: introduce polarisation scrambling via local geometry.
Inclusions: locally alter refractive index; affect both amplitude and phase.
Stress zones: modify the effective optical properties (e.g., via photo-elastic effects).
Spectral analysis using discrete Fourier transform
For further analysis, the received signal is considered as a discrete spatial sequence: ΔI[n], n = 0,1,…, N − 1.
The discrete Fourier transform (DFT) is applied to identify periodic or frequency-specific structure [46]:
High-frequency k-component corresponds to sharp discontinuities (e.g., micro-cracks).
Low-frequency component reflects gradual deformation or macro-defects.
The finite length N determines the frequency resolution:
\(
\Delta f=\frac{1}{N \cdot \Delta x}
\) (6)
where Δx is the sampling step along the rail surface.
Using finite windows results in spectral leakage. This can be reduced by applying window functions (e.g., Hann, Hamming) before the DFT.
Time-frequency localisation using discrete wavelet transform
Unlike Fourier analysis, wavelet analysis provides simulta-neous localisation in both position and scale [47]. For discrete signals, the discrete wavelet transform (DWT) is used:
where j is the scale index (related to frequency), k is the shift index (position), Ψj,k(n) are scaled and shifted versions of the chosen mother wavelet (e.g., Morlet or Daubechies).
DWT enables:
detection of isolated defects of different sizes
localisation of the defect position xk,
differentiation of overlapping defect features.
This method is particularly useful in noisy environments, since wavelets are inherently selective to characteristic scales and are robust to non-stationary disturbances.
Signal processing architecture
\(
\Delta I(n)=I_s(n)-I_p(n)
\) (8)
This signal is susceptible to local polarisation changes and effectively compensates for variations in light intensity.
To suppress high-frequency noise and environmental disturbances (e.g., vibration, surface contamination, or laser fluctuations), the signal undergoes digital filtering. A moving average filter is usually used and a Gaussian filter can be added for better smoothing.
After filtering, the signal is analysed in two parallel branches:
Fast Fourier transform (FFT) analysis reveals spectral features associated with periodic or high-gradient defects.
Wavelet analysis enables localisation of transient features in time-frequency, which makes it particularly effective for detecting micro-cracks, inclusions, corrosion pits or stress zones.
Wavelet analysis enables localisation of transient features in time-frequency, which makes it particularly effective for detecting micro-cracks, inclusions, corrosion pits or stress zones.
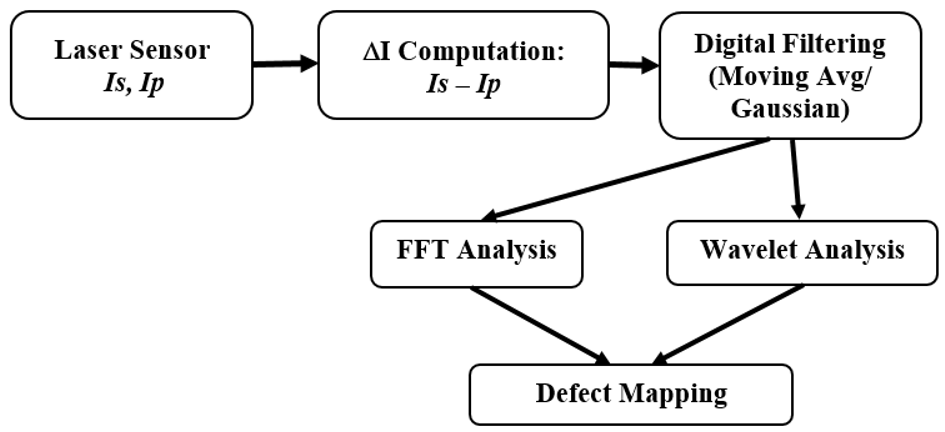
Signal processing block diagram
The overall architecture of the signal processing pipeline is illustrated in Fig. 5. The system starts by acquiring intensity signals from the laser sensors corresponding to s- and p-polarised components. The differential signal ΔI is calculated to suppress common-mode noise and enhance sensitivity to polarisation changes resulting from surface defects.
Fig. 5.Block diagram of the digital signal processing pipeline
used for rail surface-defect detection.
The process includes the acquisition of polarisation
components (Is and Ip), calculation of the differential
signal ΔI, digital filtering (using a moving average and
Gaussian filter), and subsequent analysis using both the
FFT and wavelet transform to generate a defect map.
The signal is then digitally filtered to remove high-frequency noise and stabilise the data. For in-depth analysis, two parallel branches are implemented:
FFT is used to extract frequency-domain features indicative of periodic or repeated surface structures.
Wavelet transform provides time-frequency localisation, allowing detection and classification of spatially limited defects.
The result of both analyses is integrated into a defect map, which provides spatial coordinates and an estimate of defect types along the scanned rail section.
Simulation results
Introduction to model-based testing
To evaluate the diagnostic performance of the proposed polarisation-optical inspection method under controlled and reproducible conditions, a set of model simulating experimental measurements obtained by scanning the surface of a railway rail was synthesised. These signals reflect the behaviour of the differential polarimetric response Δ𝐼𝐼, capturing both the specific features of defects and typical noise sources encountered in practical conditions.
The simulation aims to imitate real inspection scenarios, including the effect of light-surface interaction, modified by structural discontinuities or surface inhomogeneities. The following three categories of surface anomalies were modelled:
Surface cracks: are introduced as sharp, high-amplitude depression in the signal, representing abrupt local changes in geometry or material discontinuity that affect polarisation phase.
Residual stress zones: are modelled as low-frequency waves resulting from gradual changes in birefringence or local refractive index due to elastic deformation.
Noise and contamination effects: are included as high-frequency fluctuations and low-amplitude drift, simulating the influence of mechanical vibration, dust, surface roughness, and optical noise from the environment.
This simulation system provides a robust basis for testing the signal processing pipeline and assessing the sensitivity and selectivity of each diagnostic stage.
Analysis of the differential signal ΔI
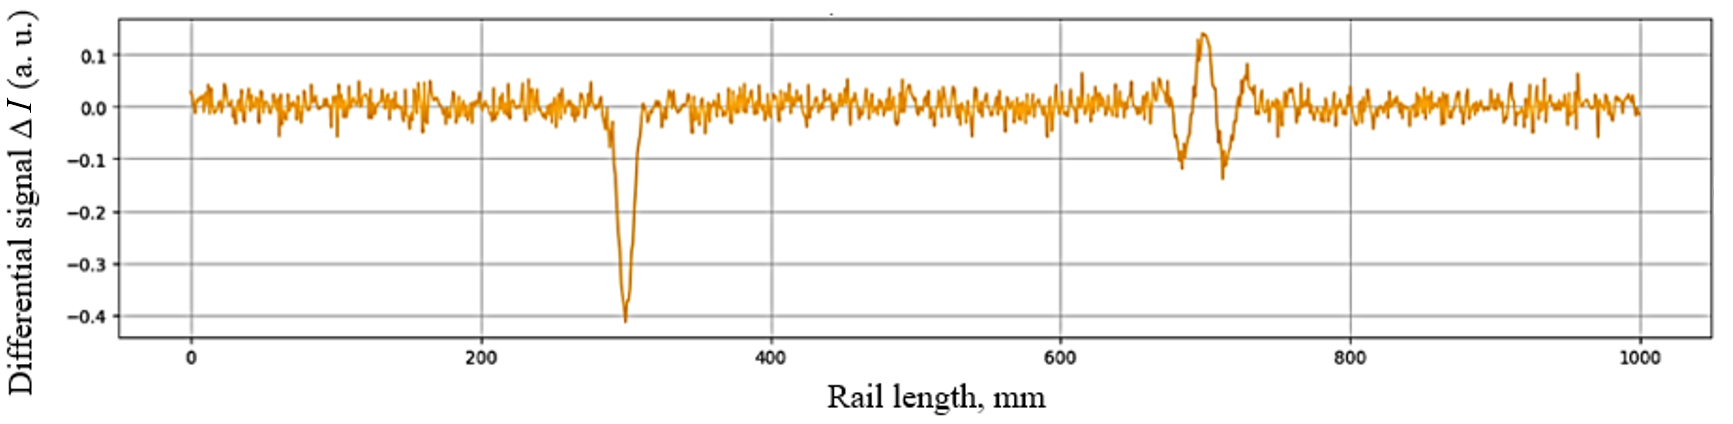
The raw differential signal ΔI(x)obtained before any signal processing, demonstrates clear features that correlate with typical surface anomalies encountered on railway rails:
A sharp, narrow intensity drop near x ≈ 300 mm corre-sponds to a simulated surface crack. This sharp signal dip arises due to local depolarisation and a reduction in the reflected s-polarised component resulting from the discontinuity of the surface normal vector and phase front distortion. The crack is modelled as a sub-millimeter pit with vertical walls, which leads to local scattering and partial loss of coherent reflection.
The slope steepness and the signal depth are directly related to the angle and depth of the crack opening: broader and deeper cracks result in a more pronounced signal drop.
Between x = 650–750 mm, the signal shows slowly varying modulations corresponding to the residual stress zone. These modulations originate from gradual changes in the local refractive index due to photoelastic effects. Compressive or tensile stress alters the local birefringence of the metal, resulting in a phase shift in the reflected beam and a deviation in its polarisation state. This results in energy transfer from the s- to the p-polarised component, reducing Is and increasing Ip, displayed as ΔI.
Peripheral regions (e.g., x < 200 mm and x > 800 mm) exhibit irregular, high-frequency fluctuations caused by surface contamination, micro-roughness, and external noise. These features simulate practical disturbances such as dust particles, oxidation layers, and rail surface irregularities that introduce stochastic changes in the reflection coefficient and scattering behavior.
These waveform features demonstrate the complexity of the polarimetric signal and the problem of defect identification in noisy environments. They also confirm the importance of applying advanced signal processing techniques to extract the relevant diagnostic content.
The output raw signal is shown in Fig. 6, clearly high-lighting the described features.
Fig. 6.Simulated differential signal ΔI(x) along the rail surface. A sharp intensity drop near 300 mm indicates a simulated surface crack;
smooth oscillations around 700 mm represent a stress zone; background fluctuations correspond to environmental noise.
Signal enhancement with digital filtering
To reduce signal perturbations unrelated to structural defects, the raw differential signal ΔI(x) was subjected to a two-stage filtering combining a moving average filter and a Gaussian smoothing filter.
These filters were chosen due to their complementary characteristics:
The moving average filter attenuates high-frequency noise by averaging local fluctuations over a sliding window, providing effective suppression of stochastic variations caused by surface contamination, sensor noise, and micro-texture.
The Gaussian filter, based on a bell-shaped kernel, applies a weighted averaging that emphasises nearby values, improving edge preservation and maintaining the spatial integrity of signal transitions.
The filtering was applied in a non-causal, symmetric manner to avoid phase distortion and preserve the timing (position) of key features in the signal. The result is a smoothed waveform in which:
Noise is significantly reduced along the entire length of the rail.
Key diagnostic transitions – such as the deep roll-off at x ≈ 300 mm and the gradual modulation around x ≈ 700 mm – remain intact.
Overall signal readability is improved, providing a clean basis for frequency-domain or time-frequency analysis in the following steps.
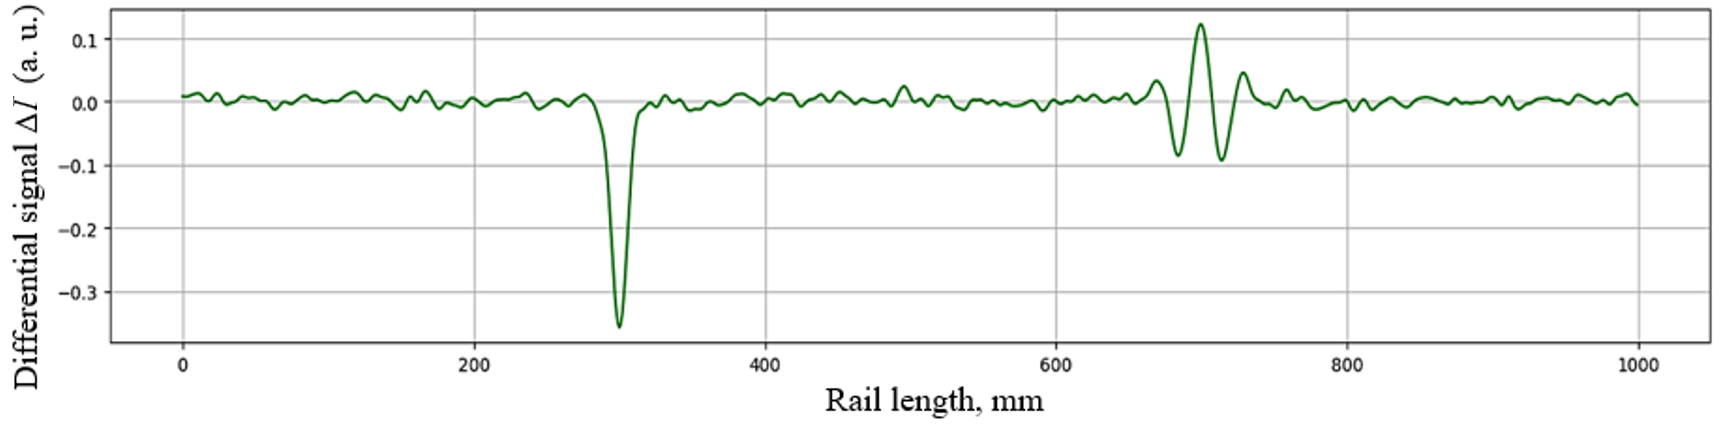
The filtering result is visualised in Fig. 7, which confirms the effectiveness of the pre-processing stage.
Fig. 7.Differential signal ΔI(x) after moving average and Gaussian filtering. The filtering effectively inhibits high-frequency noise while
preserving key diagnostic features associated with simulated crack (about 300 mm) and stress zone (about 700 mm).
Threshold-based detection of signal contours
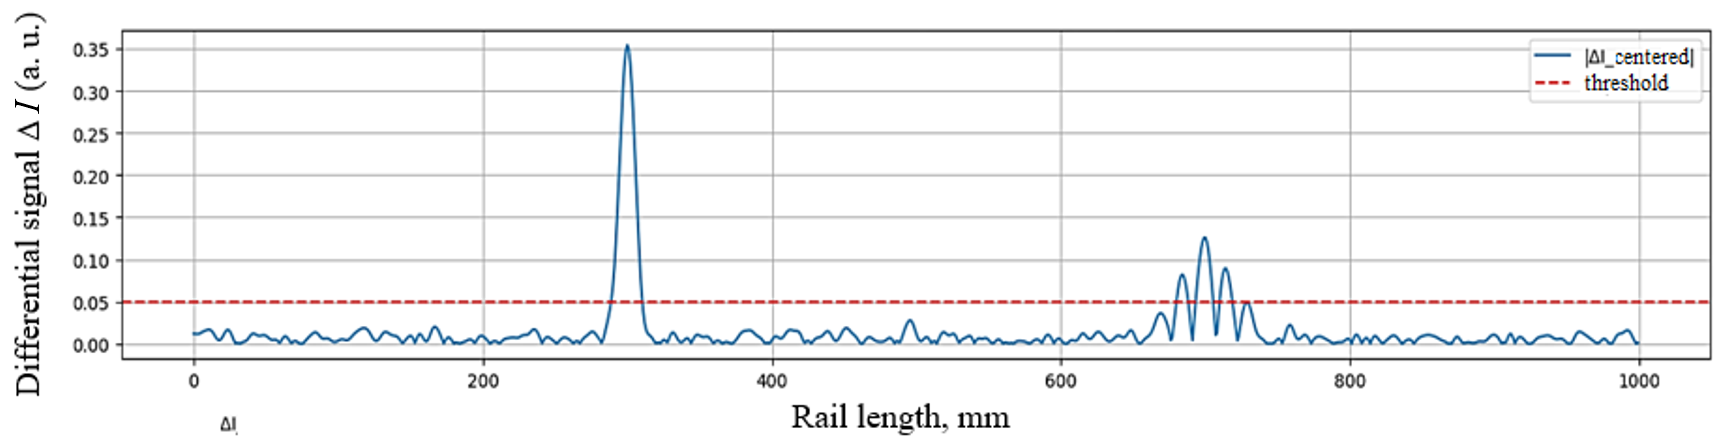
To automatically detect defect areas, an advanced processing step was introduced, which consists of applying a thresh-olding method to the amplitude envelope of the filtered signal.
This method is based on the assumption that structural defects cause local maxima in the absolute value of the differential signal, |ΔI|, that significantly exceed the back-ground level.
The calculated envelope was centred and compared to a predefined threshold (red dashed line in Fig. 8).
The threshold was selected empirically to minimise false actions caused by surface noise, while maintaining high sensitivity to real defects.
Fig. 8.Threshold-based edge detection applied to the filtered differential signal. Exceeding a certain threshold (red line)
corresponds to significant surface features such as cracks and stress zones.
The result demonstrates precise localisation of two critical areas:
A strong amplitude peak at x ≈ 300 mm, indicating a surface crack.
A group of moderate peaks about x ≈ 700 mm, associ-ated with a residual stress zone.
This contour analysis method effectively isolates signal segments that merit further analysis, making it well-suited for pre-screening and segmentation stages in automated defect classification systems.
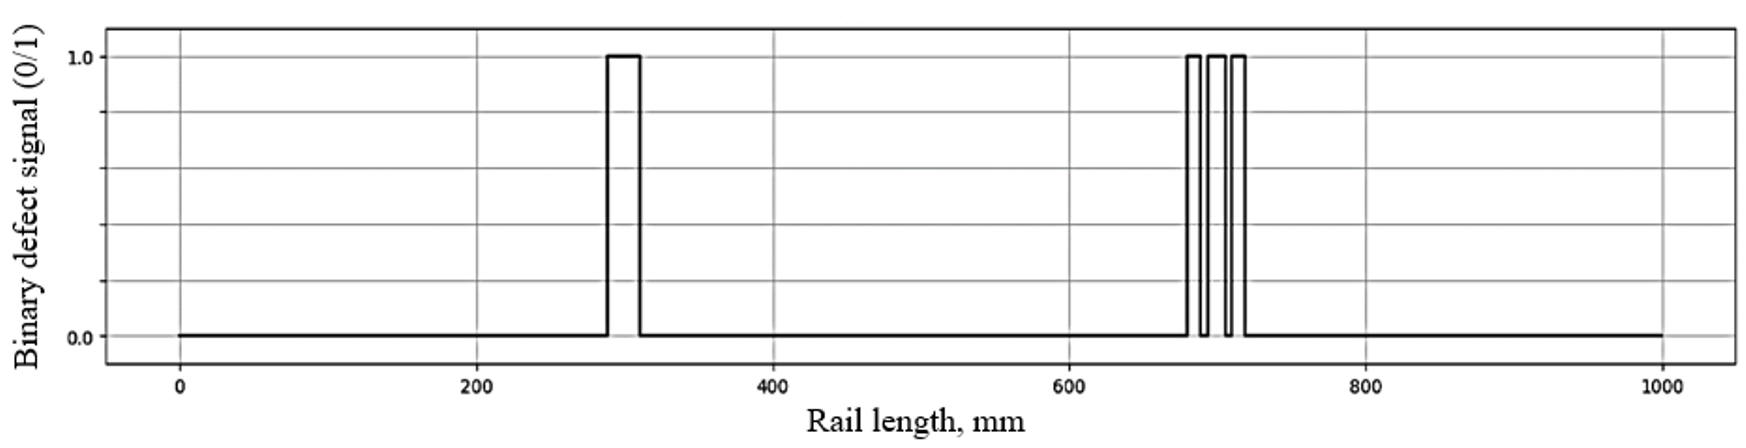
Binary representation of defect locations
For subsequent classification, marking or statistical evaluation of surface defects, the output of the threshold stage was converted into a binary digital signal. This transformation simplifies the signal into a sequence of ones and zeros, where:
1 indicates an area [of region of interest (ROI)] that exceeds the detection threshold.
0 means background or non-defective segments.
This representation is well-suited for real-time embedded processing and can serve as a trigger for defect processing modules or actuators (e.g., marking devices or alarms).
As shown in Fig. 9, the binary signal preserves the localisation of two defect zones:
Fig. 9.Binary (0/1) representation of the defect map derived from the filtered signal. Logical ‘1’ segments correspond to
regions exceeding the detection threshold.
A single wide pulse around x ≈ 300 mm, associated with a surface crack.
Multiple narrower pulses in the area of x ≈ 700 mm, corresponding to stress-related anomalies.
The digital signal can be further processed to extract parameters such as:
Number of defects
Their spatial arrangement
Estimated widths or extents (based on the duration of the ‘1’ states).
This step confirms that the method supports both quali-tative visual inspection and quantitative machine-based decision-making.
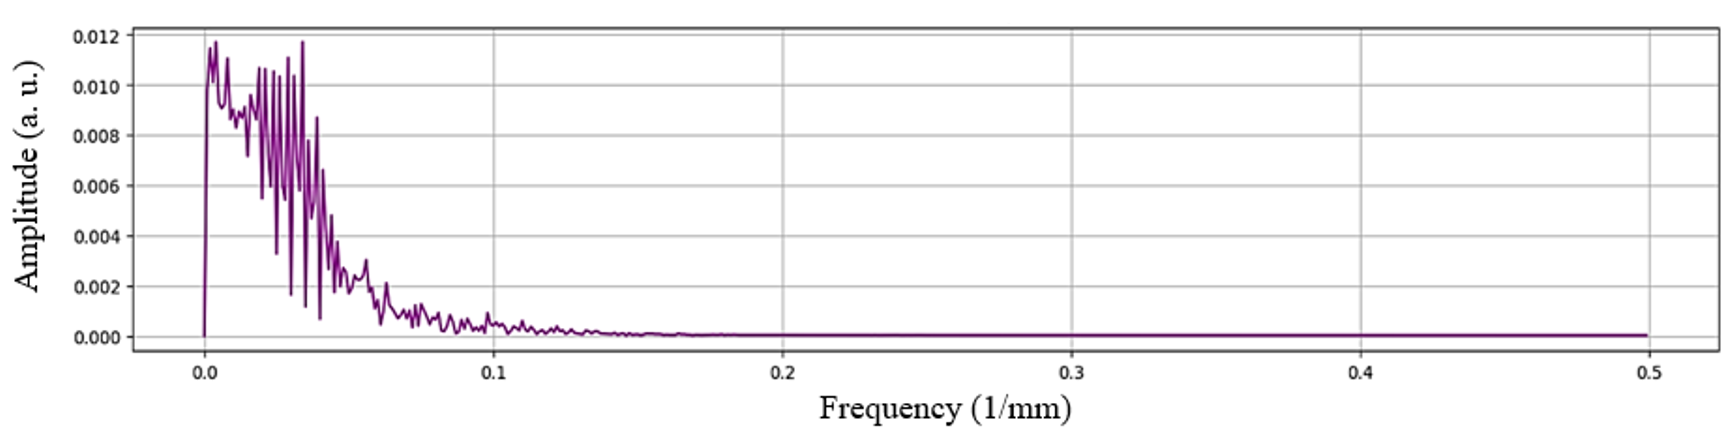
Spectral analysis using Fourier transform
To examine the frequency characteristics of the filtered differential signal, the DFT was applied. This analysis enables the identification of periodic structure or regular spatial patterns along the rail surface that may not be obvious in the time (spatial) domain.
The resulting amplitude spectrum is shown in Fig. 10. Several key observations can be made:
The spectral energy is concentrated at low frequencies (< 0.1 mm−¹), indicating that the dominant features in the signal are relatively broad and spatially extended.
A series of narrow peaks in the range of 0.01–0.08 mm−¹ suggest the presence of moderately periodic components, potentially corresponding to stress-induced waviness or structured surface roughness.
The high-frequency region (> 0.1 mm−¹) is nearly flat and close to zero, that noise components have been effectively suppressed during filtering.
Fig. 10.Fourier transform of the differential signal ΔI(x), showing dominant low-frequency components associated with largescale
variations such as stress zones and reduced high-frequency content due to filtering.
Although the Fourier transform provides valuable information about the spectral content of the signal, it lacks spatial resolution and therefore cannot localise defects. However, it plays an important role in:
Distinguishing defect types based on their frequency signatures
Optimising filter design
Supporting defect classification by comparing spectral “fingerprints” of known anomalies.
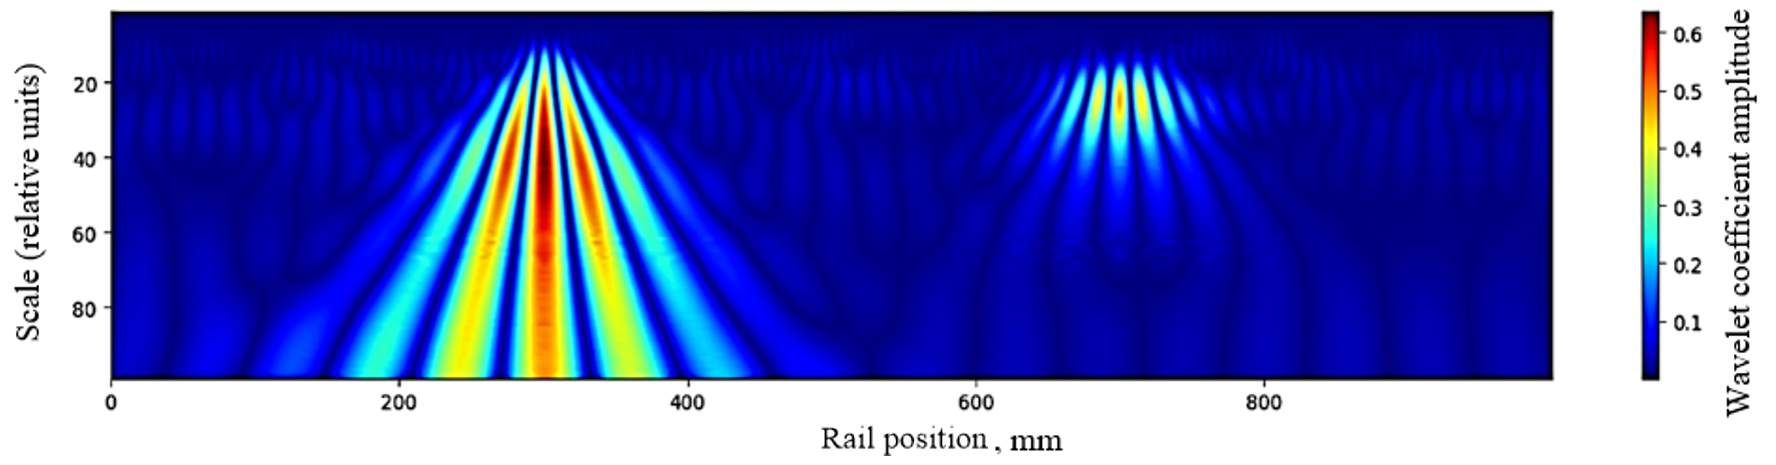
Time-frequency localisation using wavelet analysis
To achieve simultaneous localisation of defects in both space and scale, the filtered differential signal was analysed using the continuous wavelet transform (CWT) with the Morlet wavelet. This approach is well-suited for defect characterisation, as it provides multiscale resolution and high sensitivity to both abrupt and gradual signal changes.
The resulting scalogram, shown in Fig. 11, reveals distinct spectral structures:
Fig. 11.Wavelet scalogram of the filtered differential signal using the Morlet wavelet. The crack and stress zone are clearly
localised at distinct spatial positions and frequency scales.
The high-frequency spike centred at x ≈ 300 mm corresponds to a simulated surface crack, which has a strong localisation in both position and frequency.
The stress zone at x ≈ 700 mm appears as a low-frequency band, extended along the spatial axis and concentrated at lower scales
Noise-induced structures are present in the entire scale range, but show less coherence and spatial compactness compared to real defects.
The vertical axis represents the wavelet scale, which is inversely proportional to frequency. The high selectivity of the Morlet wavelet enables the precise extraction of charac-teristic features, providing reliable classification of defects.
Compared to Fourier analysis, the wavelet transform offers superior performance for detecting non-stationary or localised anomalies, making it a crucial tool in the proposed inspection pipeline.
Summary of diagnostic capabilities
The simulation tests illustrate the expected operating margin, pending experimental validation of the proposed polarisation-optical diagnostic method for detecting and localising surface defects on railway rails. Due to the combination of differential polarimetric measurements, advanced signal filtering, and frequency-time analysis, the method exhibits several critical advantages:
Sensitivity to sharp surface discontinuities: formation of a differential signal enables the detection of narrow surface cracks, which appear as clear amplitude drops in the Δ𝐼𝐼 signal. This ensures high sensitivity to sharp changes in surface topology or optical properties.
Capability to resolve stress-related deformations: gradual modulations of the signal associated with residual mechanical stress are reliably captured due to the polarisation sensitivity of the setup and the preser-vation of low-frequency components during filtering.
Noise resilience and robustness: combined use of moving average and Gaussian filters effectively reduces high-frequency noise and environmental disturbances (e.g., vibration, contamination), enhancing the clarity and diagnostic quality of the signal.
Multiscale defect characterisation: wavelet transform analysis provides precise localisation and classification of anomalies by mapping the signal energy in both spatial and spectral domains. This enables differen-tiation between cracks, stress zones, and non-structural noise.
Verification of the stress-dependent polarimetric per-turbation will be given priority in the planned load-frame and bending trials scheduled for the next project phase.
Furthermore, the modular nature of the signal processing pipeline, from acquisition to binary classification, facilitates integration into automated rail inspection systems, supporting real-time defect detection, recording, and decision-making.
These results demonstrate that the developed method is not only theoretically sound but also practically viable for field conditions, contributing to the modernisation of non-destructive testing practices for railway infrastructure monitoring.
Conclusions
This study presents a novel polarisation-optical method for detecting and characterising surface defects in railway rails. The approach leverages the sensitivity of polarised laser radiation to microstructural surface changes, employing differential measurement of orthogonal polarisation components to enhance defect contrast and suppress external noise.
A modular digital signal processing pipeline is developed, including filtering, threshold-based segmenta-tion, and both spectral and time-frequency analysis methods.
Preliminary assessment of the method was conducted using a series of simulated defect scenarios. These tests demonstrate that, under idealised conditions, the algorithm is capable of detecting features associated with surface cracks, stress‑induced birefringent regions, and artifacts simulating noise or contamination.
The combined use of polarimetric sensing and wavelet‑based analysis enables mapping and differen-tiation of anomalies based on their spatial and spectral characteristics.
The results obtained so far indicate that the proposed polarisation-optical approach is potentially sensitive to surface defects – down to micro-crack dimensions – pending confirmation on full-size rail sections. Under optimal conditions, it can detect defects earlier and more reliably than conventional visual or intensity (non-polarised) methods. Although the approach is demanding in terms of setup and operating conditions (clean surface, optical stability), its application in rail non-destructive inspection systems is quite possible. It can complement existing ultrasonic and magnetic methods by providing information about the condition of the rail surface (where cracks and corrosion typically begin). Thus, using differential signals between the s- and p-polarised components of the reflected laser beam represents an effective strategy for early detection of dangerous defects on railroad rails.
These initial results suggest that the approach could support real-time, non-contact inspection; however, final conclusions require experimental validation using real-world data.
Acknowledgements
This research was supported by the Department of Correlation Optics at Yuriy Fedkovych Chernivtsi National University and of the National Research Foundation of Ukraine (NRFU), project no. 2025.06/0086 ‘Innovative Methods and Systems of Laser Communication in Turbulent Atmospheric Environments Based on Phase Singularities’.
Data availability statement
The original contributions presented in this study are included in this article/supplementary material; further inquiries can be directed to the corresponding authors.
Author contributions
O.A. organised the database. M.S. wrote the first draft of the manuscript. All authors contributed to conception and design of the study, wrote sections of the manuscript, revised the manuscript, and read and approved the submitted version.
Funding
This research was funded by Taizhou Institute of Zhejiang University, Taizhou, China.
Conflict of interest
The authors declare that the research was conducted in the absence of any commercial or financial relationships that could be construed as a potential conflict of interest.
Publisher’s note
All claims expressed in this article are solely those of the authors and do not necessarily represent those of their affiliated organisations, or those of the publisher, the editors and the reviewers.
Any product that may be evaluated in this article, or claim that may be made by its manufacturer, is not guaranteed or endorsed by the publisher.
References
Kaewunruen, S., Sussman J. M. & Matsumoto, A. Grand challenges in transportation and transit systems. Front. Built Environ. 2, 4 (2016). https://doi.org/10.3389/fbuil.2016.00004
de Melo, A. L. O., Kaewunruen, S., Papaelias, M. & Bernucci,L. L. B. Methods to monitor and evaluate the deterioration of track and its components in a railway in-service: A systematic review. Front. Built Environ. 6, 118 (2020). https://doi.org/10.3389/fbuil.2020.00118
Bianchi, G., Fanelli, C., Freddi, F., Giuliani, F. & La Placa, A. Systematic review railway infrastructure monitoring: From classic techniques to predictive maintenance. Adv. Mech. Eng. 17, 128563 (2025). https://doi.org/10.1177/16878132241285631
International Organization for Standardization (ISO). Non- destructive testing – Ultrasonic testing – General principles. ISO 16810, 2nd ed. (ISO, 2024). https://doi.org/10.31030/3582259
Tyystjärvi, T., Jessen-Juhler, O., Koskinen, T. & Virkkunen, I. AI- assisted ultrasonic testing of rails – A case study. in Proceedings of the 61st Annual British Conference on Non-Destructive Testing 1– 6 (The British Institute of Non-Destructive Testing, 2024). https://doi.org/10.1784/ndt2024.4b1
Zhang, G., Song, Z., Osotuyi, A. G., Lin, R. & Chi, B. Railway traffic monitoring with trackside fiber-optic cable by distributed acoustic sensing technology. Front. Earth Sci. 10, 990837 (2022). https://doi.org/10.3389/feart.2022.990837
Mi, Z., Chen, R. & Zhao, S. Research on steel rail surface defects detection based on improved YOLOv4 network. Front. Neurorobotics 17, 1119896 (2023). https://doi.org/10.3389/fnbot.2023.1119896
He, Z., Gao, X., Liu, Z., An, X. & Zheng, A. Rail surface defect data enhancement method based on improved ACGAN. Front. Neurorobotics 18, 1397369 (2024). https://doi.org/10.3389/fnbot.2024.1397369
Xiong, Z., Li, Q., Mao, Q. & Zou, Q. A 3D laser profiling system for rail surface defect detection. Sensors 17, 1791 (2017). https://doi.org/10.3390/s17081791
Zhao, Y. et al. A review on rail defect detection systems based on wireless sensors. Sensors 22, 6409 (2022). https://doi.org/10.3390/s22176409
Lomaka, S. & Strynadko, M. Hybrid control system for maglev tracks with enhanced accuracy and resistance to contamination. Young Sci. 1, 25 (2025).
Sresakoolchai, J. & Kaewunruen, S. Detection and severity evaluation of combined rail defects using deep learning. Vibration 4, 341–356 (2021). https://doi.org/10.3390/vibration4020022
Bojarczak, P. Application of wavelet transform into precise localization of railway rail edges in visual diagnostic of track. Arch. Transp. 24 1–16 (2012). <https://doi.org/10.2478/v10174-012-0001-9
Mackiewicz, S. et al. Modeling of acoustic coupling of ultrasonic probes for high-speed rail track inspection. Arch. Acoust. 49, 255– 266 (2024). https://doi.org/10.24425/aoa.2024.148787
Rucki, M., Gockiewicz, A. & Szumiata, T. Evaluation of the residual magnetic field measurement system for early identification of railway defects. Metrol. Meas. Syst. 26, 687–696 (2019). https://doi.org/10.24425/mms.2019.130568
Yu, Z., Wang, Y. & Wu, X. Defect detection method for large- curvature and highly reflective surfaces based on polarization imaging and improved YOLOv11. Photonics 12, 1234 (2025). https://doi.org/10.3390/photonics12040368
Kou, L., Sysyn, M., Fischer, S., Liu, J. & Nabochenko, O. Optical rail surface crack detection method based on semantic segmentation replacement for magnetic particle inspection. Sensors 22, 8214 (2022). https://doi.org/10.3390/s22218214
Lian, Y. et al. Simulation and experimental research of V-crack testing of rail surfaces based on laser ultrasound. Photonics 11, 920 (2024). https://doi.org/10.3390/photonics11100920
Xu, P., Zhu, C. L., Zeng, H. M. & Wang, P. Rail crack detection and evaluation at high speed based on differential ECT system. Measurement 166, 108152 (2020). https://doi.org/10.1016/j.measurement.2020.108152
Meyer, K. A., Gren, D., Ahlström, J. & Ekberg, A. A method for in-field railhead crack detection using digital image correlation. Int.J. Rail Transp. 10, 675–694 (2022).https://doi.org/10.1080/23248378.2021.2021455
Dickheuer, S. et al. (2019). Polarization by light reflection at metallic surfaces observed in the shape of the Balmer-α line of low-temperature hydrogen plasmas. Phys. Plasmas 26, 073513 (2019). https://doi.org/10.1063/1.5088931
Angelsky, O. V., Mokhun, I. I., Bekshaev, A. Y., Zenkova, C. Y. & Zheng, J. Polarization singularities: Topological and dynamical aspects. Front. Phys. 11, 1147788 (2023). https://doi.org/10.3389/fphy.2023.1147788
Angelsky, O. V., Bekshaev, A. Y., Vasnetsov, M. V., Maksimyak,
P. P. & Zheng, J. Optical phase singularities: Physical nature, manifestations and applications. Front. Phys. 10, 1060787 (2022). https://doi.org/10.3389/fphy.2022.1060787
Angelsky, O. V. et al. Fluorescence record diagnostics of 3D rough-surface landscapes with nano-scale inhomogeneities. Front.Phys. 9, 787821 (2022). https://doi.org/10.3389/fphy.2021.787821
Angelsky, O. V. et al. Review on the structured light properties: Rotational features and singularities. Opto-Electron. Rev. 30, e140860 (2022). https://doi.org/10.24425/opelre.2022.140860
Angelsky, O. V., Ushenko, A. G., Ushenko, Y. A. & Pishak, V. P. Statistical and Fractal Structure of Biological Tissue Mueller Matrix Images. in Optical Correlation Techniques and Applications(ed. Angelsky, O. V.) 213–265 (SPIE Press, 2007). https://doi.org/10.1117/3.714999.ch4
Cui, Z. et al. Ultra-compact and high-precision differential detection method based on liquid crystal polarization grating for miniature atomic magnetometer. Nanophotonics 13, 4255–4265 (2024). https://doi.org/10.1515/nanoph-2024-0309
Lu, Y. et al. Recent progress of atomic magnetometers for geomagnetic applications. Sensors 23, 5318 (2023). https://doi.org/10.3390/s23115318
Li, R. et al. Investigation of surface defects in optical components based on reflection Mueller matrix spectroscopy. Appl. Sci. 13, 9294 (2023). https://doi.org/10.3390/app13169294
Kim, H.-S., Park, D.-W., Kim, S.-I., Oh, G.-H. & Kim, H.-S.(2023). Non-destructive detection of thin micro-defects in glass reinforced polymer composites using a terahertz electro-magnetic wave based on a convolution neural network. Compos. B: Eng. 257, 110694 (2023).https://doi.org/10.1016/j.compositesb.2023.110694
Mayorga-Cruz, D., Márquez-Aguilar, P. A., Sarmiento-Martínez,O. & Uruchurtu-Chavarín, J. Investigation of corrosion processes in metallic samples by optical and electrochemical methods. Opt. Lasers Eng. 45, 953–959 (2007).https://doi.org/10.1016/j.optlaseng.2007.03.001
Ali, J. H., Wang, W. B., Ho, P. P. & Alfano, R. R. Detection of corrosion beneath a paint layer by use of spectral polarization optical imaging. Opt. Lett. 25, 1303–1305 (2000). https://doi.org/10.1364/OL.25.001303
Morel, O. & Gorria, P. Polarization imaging for 3D inspection of highly reflective metallic objects. Opt. Spectrosc. 101, 11–17 (2006). https://doi.org/10.1134/S0030400X06070034
Hatakeyama, T., Ichinoseki, K., Fukuda, K., Higuchi, N. & Arai,K. Evaluation of the quality of commercial silicon carbide wafers by an optical non-destructive inspection technique. J. Cryst. Growth 310, 988–992 (2008).https://doi.org/10.1016/j.jcrysgro.2007.11.141
Song, B. et al. Investigation polarimetric scattering of light from the randomly rough surface based on the calculation of the Mueller matrix. Opt. Express 31, 24796–24809 (2023). https://doi.org/10.1364/OE.492780
Hou, W., Tao, X. & Xu, D. Combining prior knowledge with CNN for weak scratch inspection of optical components. IEEE Trans. Instrum. Meas. 70, 1–11 (2021). https://doi.org/10.1109/TIM.2020.3011299
Bass, M. Handbook of Optics. Vol. I: Fundamentals, Techniques, and Design. (McGraw-Hill, (2010).
Born, M. & Wolf E. Principles of Optics: Electromagnetic Theory of Propagation, Interference and Diffraction of Ligh, 7th edition. (Cambridge University Press, 1999).
Devasahayam, S. R. Discrete Signal Processing. in Signals and Systems in Biomedical Engineering. Signal Processing and Physiological Systems Modeling, 2nd ed. 121–171 (Springer, 2013). https://doi.org/10.1007/978-1-4614-5332-1_6
Mallat, S. A. Wavelet Tour of Signal Processing: The Sparse Way, 3rd ed. (Academic Press, 2008).