Department of Optoelectronics, Faculty of Electrical Engineering, Silesian University of Technology, ul. Bolesława Krzywoustego 2, 44-100 Gliwice, Poland
Article Info
Received 09 Jul. 2025
Received in revised form 31 Aug. 2025
Accepted 04 Sep. 2025
Available on-line 15 Oct. 2025
Keywords: glass; ion-exchange; gradient lenses; ray trajectory; spherical aberration.
The paper presents theoretical possibilities for producing planar gradient microlenses in soda-lime glass using the Ag+↔Na+ ion exchange method. The modelling of ion exchange processes (pre-diffusion, heating) was used to calculate two-dimensional refractive profiles. A mathematical model of ion exchange was used, considering the dependence of the diffusion coefficients of exchanged ions on their normalised concentrations. Simulations of changes in refraction in glass are based on experimental results. An algorithm based on Snell’s law is used to calculate ray trajectories, determining the refractive properties of microlenses. The proposed algorithm allows determining ray trajectories with arbitrarily small steps in the gradient region of the glass. The refractive properties of the modelled gradient microlenses were analysed for meridional beams. The numerical modelling shows the influence of controlled grinding of the glass surface on the focusing properties of the microlenses. This allows for very good correction of the spherical aberration in manufactured microlenses.
Introduction
The intensive development of microelectronics observed in recent years has stimulated research on micro-optical element technologies. The role of micro-optics is vital in acquiring, processing, and transmitting information. Photonic technologies strive for large-scale miniaturisation of elements, among which microlenses are widely used. They are used in fibre optic communication as elements of fibre optic connectors, beam collimators, optical couplers, optical isolators, fibre optic switches, and the architecture of wavelength division multiplexing (WDM) systems. Microlenses are also used in imaging systems as lens arrays in image reading (copying devices) and all types of endoscopes (medical applications). Due to their structure, they can be divided into two basic groups: cylindrical lenses (in the form of rods or fibres) and planar lenses (manufactured on or in flat substrates).
Refraction in planar microlenses can be induced by the gradient of the refractive index or by the shape of the region of a uniform refractive index. There are already many tech-nologies available for such element manufacturing [1, 2].
The first historical technologies for creating microlens arrays were based on glass. Various manufacturing tech-niques have been used: ion exchange [3], photo-thermal expansion [4], reactive ion etching [5], and laser ablation techniques [6]. Recently, technologies based on optical polymers have been increasingly widely used. These can be photopolymers (photoresists) from which the topology of matrices is formed using photolithographic processes. The first works used thermal processes (reflow) to shape structures that provide refractive properties [7]. Newer technologies of this type are based on electron lithography [8]. Significant progress in using optical polymers for producing microlens matrices is made possible by new techniques, including thermal imprinting (hot embossing) and micro-droplet jetting [9]. The hot embossing method is also used for glasses [10, 11].
Recently, advanced technologies based on two-photon photolithography, utilising a femtosecond laser for the photo-polymerisation of negative photoresist [12], have been employed. Ellipsoidal microlenses produced by this method can be used for light transmission in emitter/ detector systems.
Ion exchange – planar microlenses
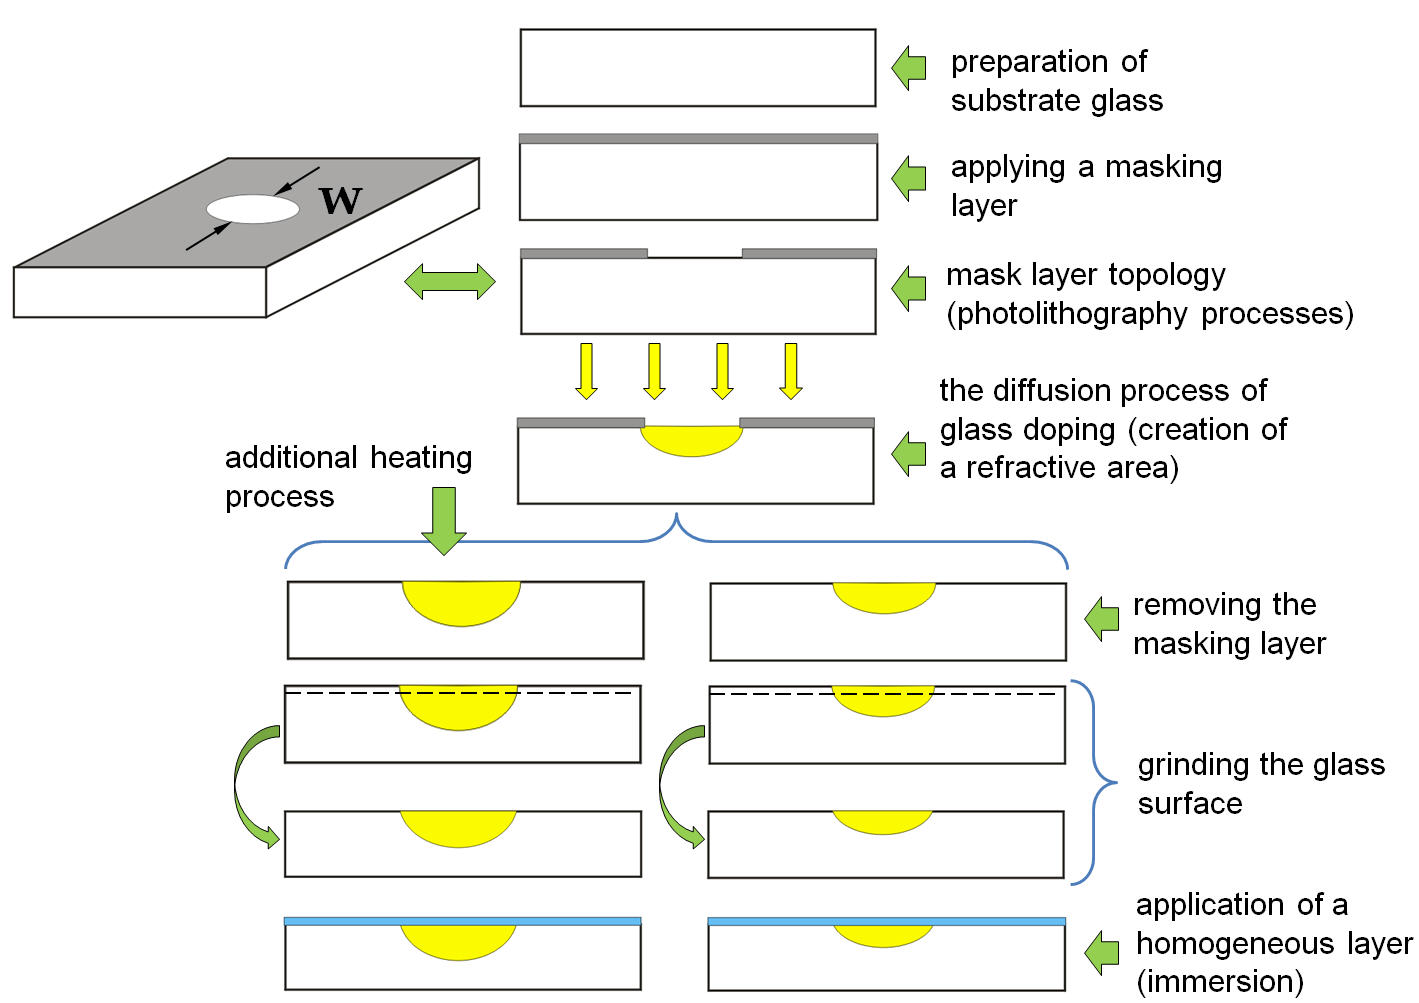
The ion exchange method, a cost-effective and straight-forward approach, was used in the 1980s to produce planar microlenses with gradient characteristics [3]. Its limitations include a relatively low change in glass refraction of the order of 0.1. Diffusion processes of ion exchange occurring at the glass surface are isotropic. Using layers to mask the glass surface allows for selective changes in refraction in its near-surface area. If the window masking the glass surface in the diffusion process has a circular shape, the gradient changes in refraction may have a geometry close to hemispherical. The scale of changes in refraction is determined by the kinetics of the diffusion process, which is a function of temperature.
In addition to the processes of diffusional introduction of dopant ions into the glass, secondary heating processes can also be used. Such processes can be carried out at high temperatures (limited by the glass softening temperature). In such processes, the existing distribution of dopant ions in the glass (refraction gradient) is further diffused.
Knowledge of the temperature characteristics of the diffusion constants of exchanged ions enables full control of the processes in real time [13]. This control enables ongoing monitoring of changes in glass refraction in a one-dimensional case through numerical modelling of the diffusion (heating) process. Comparison of the meas-urement results for the effective refractive indices of the modes in the manufactured planar waveguides with the modelling results yields an agreement at the level of 10-3–10-4 [14].
The computational time cost of a two-dimensional modelling of diffusion processes prevents its use for real-time process control. However, it is possible to simulate in real time the formation of a one-dimensional structure corresponding to the assumed case of a two-dimensional model.
Planar microlenses – technological processes
The production of planar microlenses by the ion exchange method consists of a series of processes shown in Fig. 1.
Fig. 1.Technological processes for manufacturing planar
microlenses using the ion exchange method.
After the initial diffusion, an additional heating process can be applied. This process will diffuse the existing dopant distribution in the glass. The range of refraction changes will be increased. This will also be accompanied by a decrease in the maximum value of the refraction change in this region [15]. This phenomenon should be considered when designing the lens refractive properties. The proposed surface grinding of glass with a gradient structure is analogous to reducing the thickness of a hemispherical lens (on a macro scale) made of glass with a uniform refractive index. This method limits the contribution of rays distant from the optical axis, reducing spherical aberration. Applying an immersion layer with an appropriately selected refractive index to the ground surface will minimise the scattering effect.
Planar microlenses – numerical computations
n the adopted method of calculating the trajectories of rays in the gradient areas of planar microlenses, a simplified analysis was used, in which the courses of all rays that lie in planes containing the optical axis of the microlens (meridional rays) are determined. Therefore, oblique rays are not analysed. However, this does not render the analysis worthless, as it allows for conclusions about the focusing properties of the microlenses. In this case, the numerical calculations are also simplified (time gain). In this work, it was assumed that a three-dimensional refractive profile of a gradient microlens produced in selective diffusion processes using a mask with a diameter “w” (Fig. 1) can be replaced by a two-dimensional refractive profile of the cross-section of a strip optical fibre calculated for the same mask. In the applied method for calculating two-dimen-sional refractive profiles of planar gradient microlenses cross-sections, the data obtained for the exchange of Ag+↔Na+ ions in soda-lime glass were assumed [13, 14].
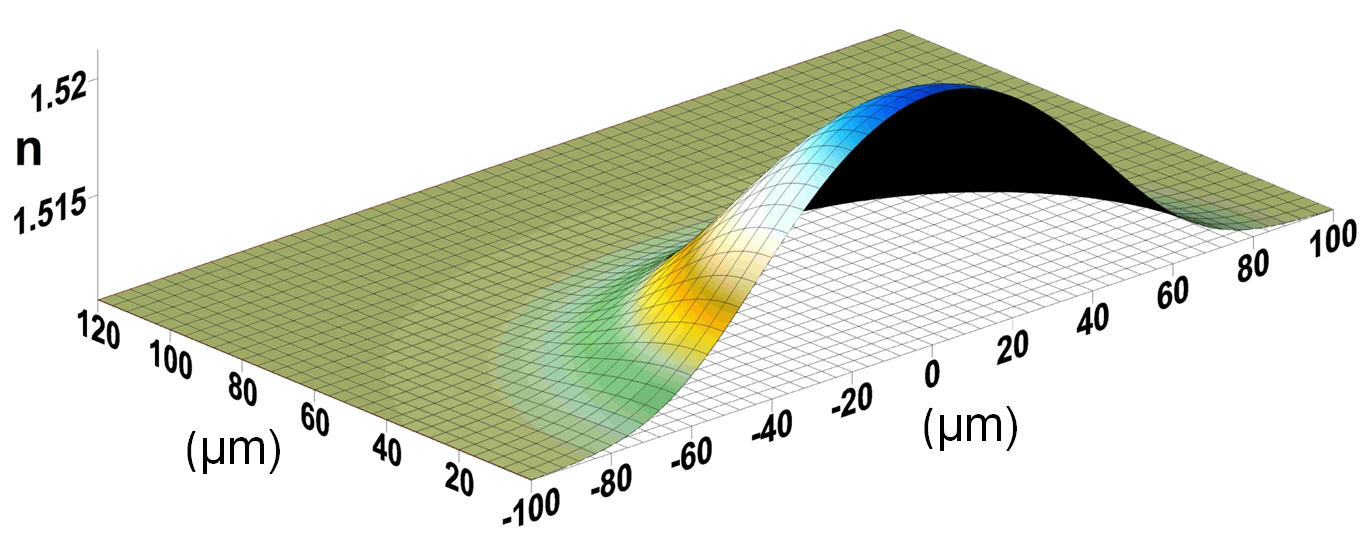
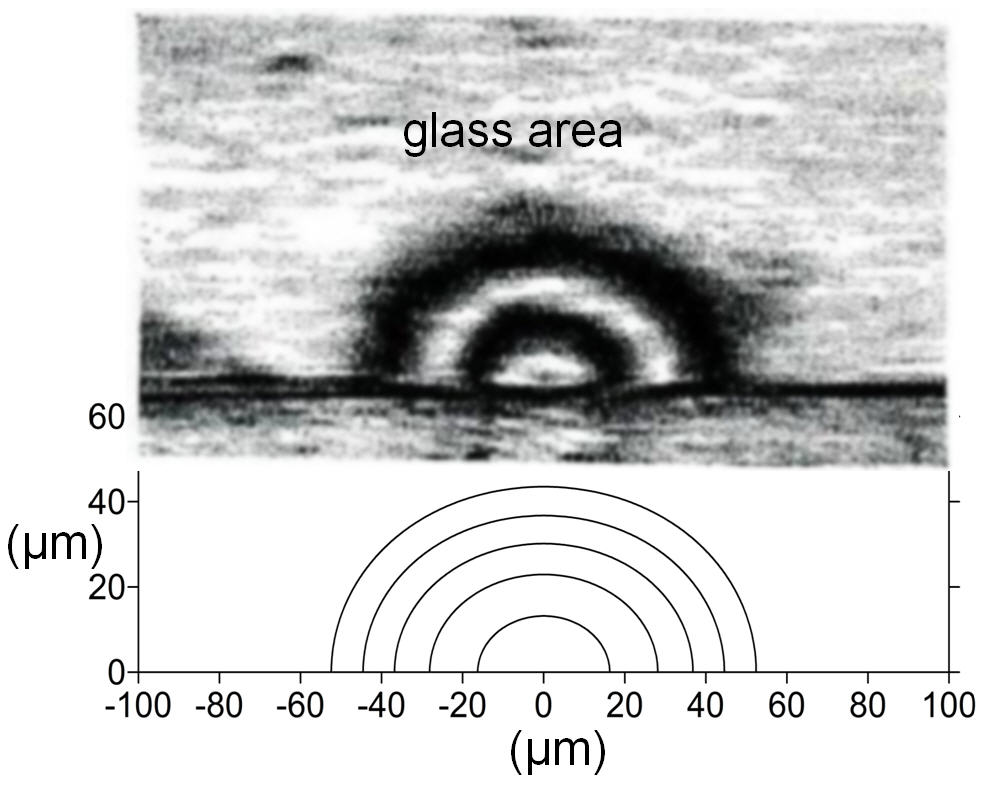
Fig. 2 presents the results of numerical calculations
for the selective pre-diffusion process with the following process parameters: Tdiff= 300 °C, tdiff= 4 h, carried out by an aluminium mask with a window width of w = 50 μm and an additional heating process of the produced structure. The heating process parameters: Theat = 450 °C, theat = 2h. After removing the masking layer during the pre-diffusion process, the sample was heated. Calculation results presented in two dimensions were superimposed (to scale) with an image of interference fringes obtained from a stripe optical waveguide sample produced in the above-mentioned process [Fig. 2(b)]. The interference image was recorded using a BIOLAR PI microscope in a homogeneous interference field [16]. To obtain it, a sample was prepared, which was cut from a strip optical waveguide (a plane perpendicular to the waveguide axis). This sample was ground to a thickness of ~ 210 μm. A wavelength of λ = 677 nm was used to generate the interference image. The presented results enable us to conclude that the numerical modelling is of high quality and was further used to analyse the refractive properties of the microlenses.
Fig. 2.(a) Numerical calculations of the refraction of soda-lime
glass produced in the Ag+↔Na+ ion exchange process
(diffusion + heating), (b) along with superimposed (to
scale) images of the sample interference fringes.
Ray trajectories – ray-tracing algorithm
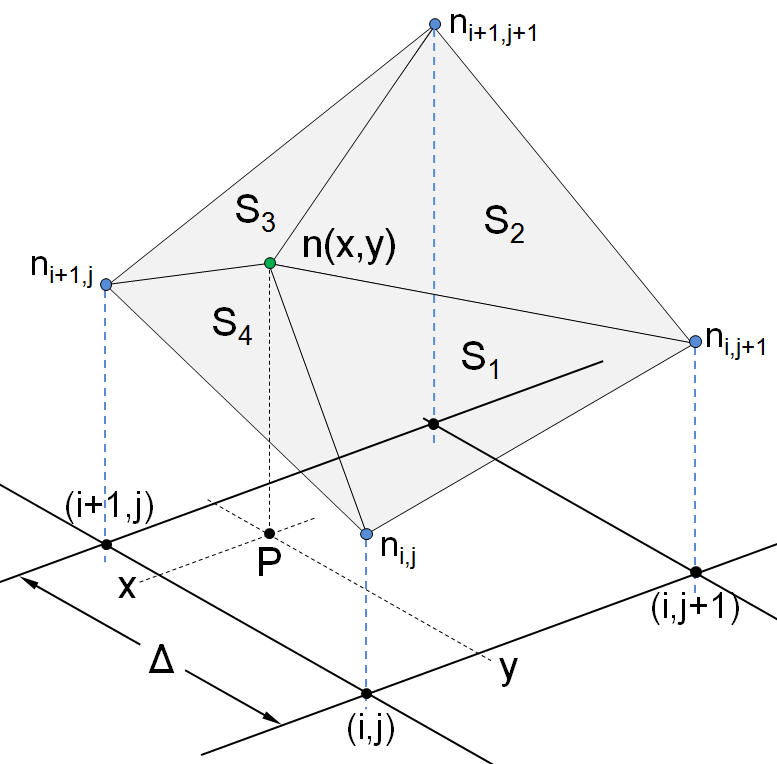
The refractive properties of planar gradient microlenses were described based on numerically calculated glass refraction profiles. A two-dimensional diffusion model was used here, considering the dependence of the diffusion constants of exchanged ions on their normalised concentra-tions [13–15]. The calculations were performed on a square grid with a spatial step of Δ = 0.5 μm. The method of calculating the refractive index n(x,y) at any point P(x,y) of the grid internode is presented in Fig. 3. Based on the known values of ni,j, ni+1,j, ni+1,j+1, and ni,j+1 calculated at the grid nodes, the value of n(x,y) is determined to minimise the sum of the areas S1...S4 of the triangles (Fig. 3). When the point P(x,y) falls on a section connecting adjacent grid nodes, linear interpolation is used.
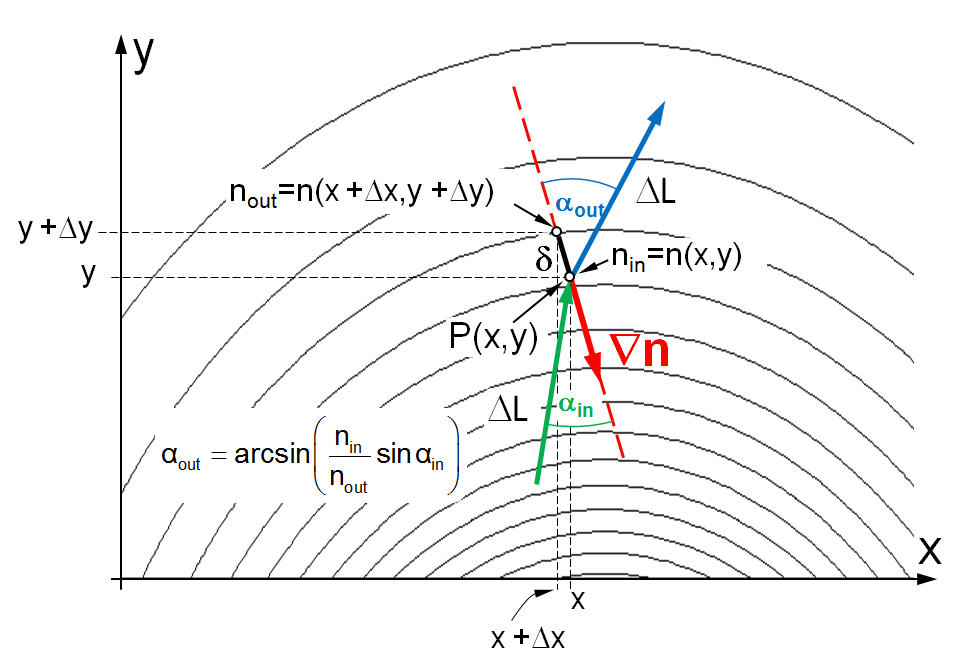
Knowledge of the refractive index at any point in the gradient region allows the application of Snell’s law to determine the trajectory of rays. This trajectory is approximated by steps of length ΔL each. This value can be arbitrarily small. For each point P(x,y) of the gradient region reached by the travelling ray, nin is calculated according to the principle shown in Fig. 3, and then the gradient vector ∇n of the refractive index is determined. The angle αin (Fig. 4) is created by the directions of the gradient vector and the ray arriving at point P(x,y). In the direction of the gradient vector ∇n at a distance δ ≤ ΔL from point P(x,y), considering the direction of the travelling ray, the value of nout is calculated. From Snell’s law, the value of the angle αout is calculated, which determines the direction of the outgoing ray relative to the direction of the gradient vector ∇n. The algorithm used also takes into account the possible phenomenon of total internal reflection.
Fig. 4.Method of determining nout for point P(x,y) of the
gradient region.
Ray-tracing algorithm – test
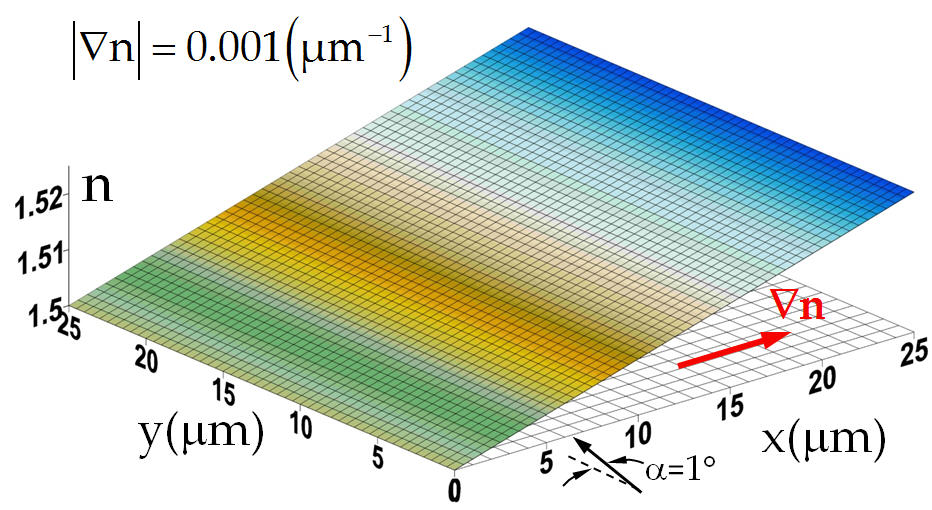
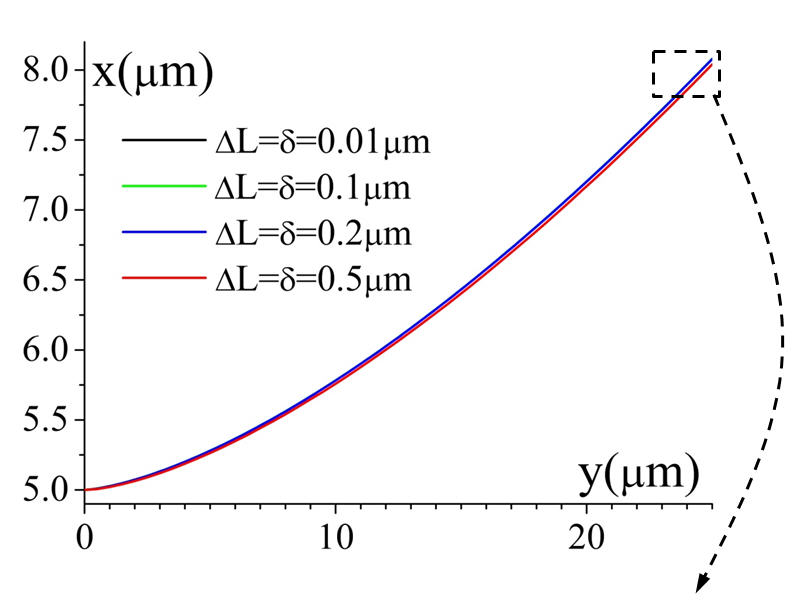
The proposed algorithm was tested for different step sizes ΔL = δ. The results of this test are shown in Fig. 5. The test region was a gradient wedge [Fig. 5(a)]. The gradient modulus was constant |∇n| = 0.001 (μm−1). In each case, the radius at the entrance to the gradient region formed an angle α = 1° with the direction perpendicular to the gradient vector.
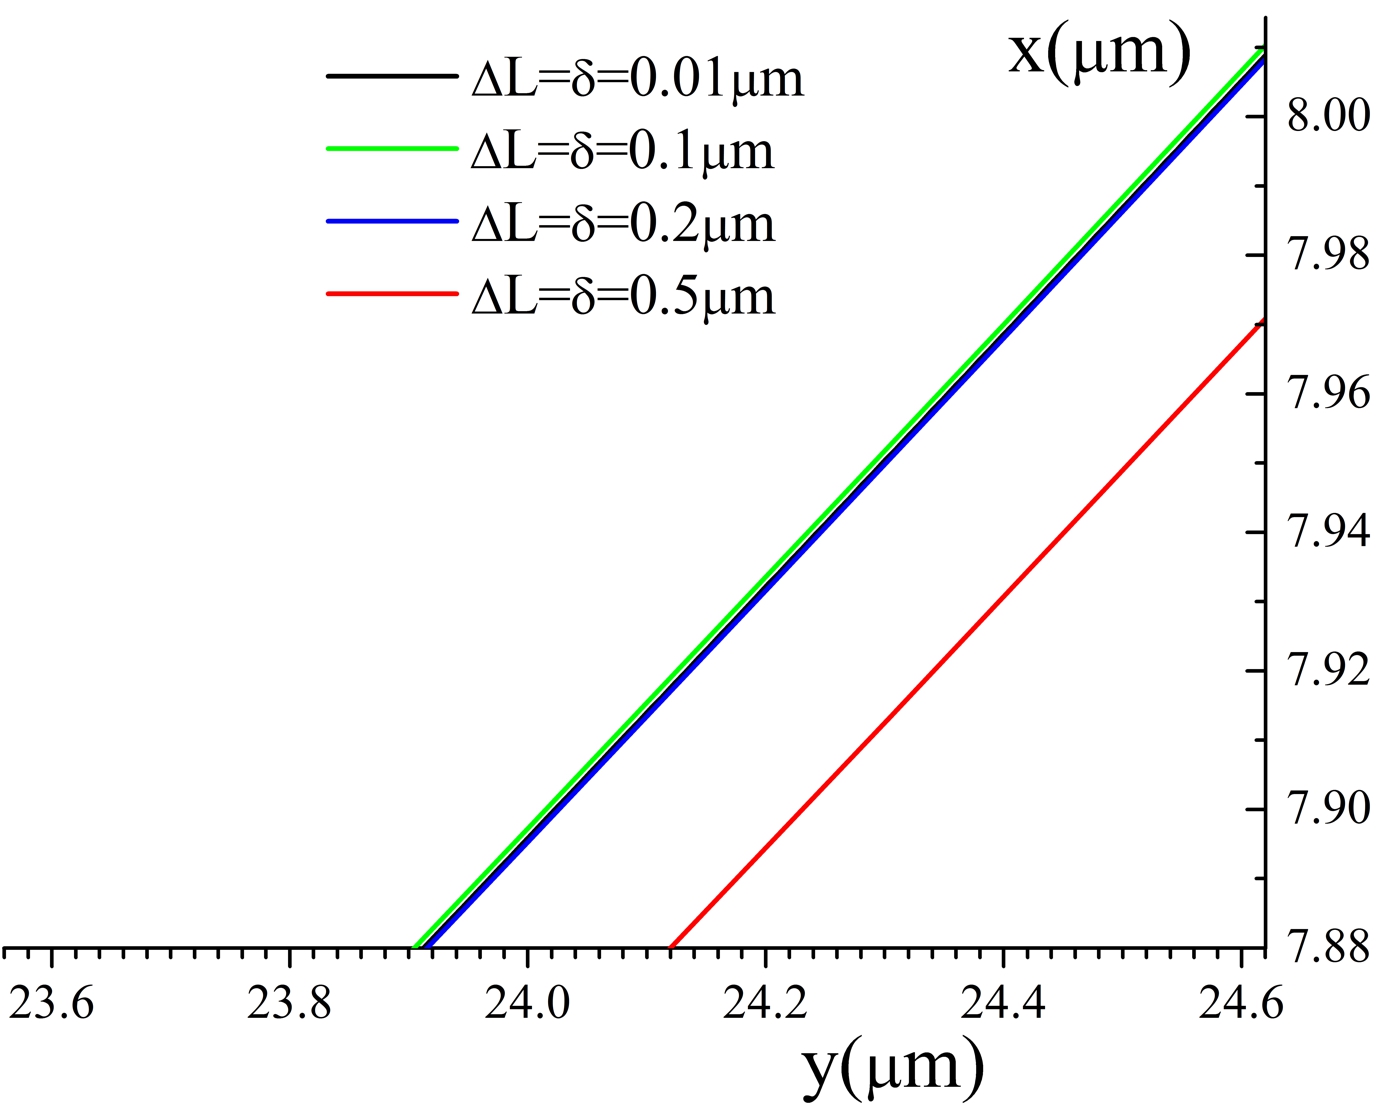
Figures 5(b) and 5(c) show the ray trajectories for different values of the ΔL = δ steps.
In all further calculations of ray trajectories, the values ΔL = δ = 0.1 μm were assumed.
Fig. 5.Test of the algorithm. (a) Gradient wedge. (b) Ray
trajectories for different values of ΔL=δ. (c) Enlarged
ends of ray trajectories.
Refractive properties of gradient microlenses
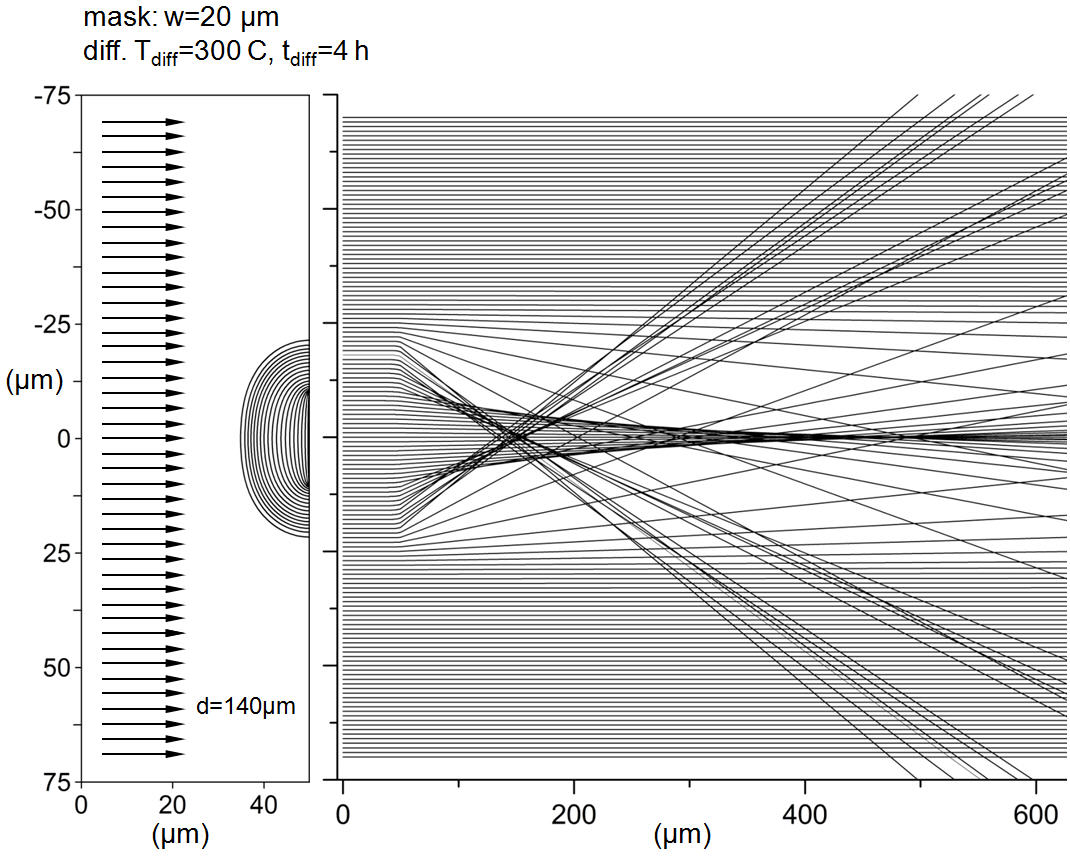
The exemplary analysis of refractive properties was based on numerical calculations of the trajectories of parallel beams passing through glass areas with changed refraction in the diffusion and heating processes. In each analysed case, the beam had a width of d = 140 μm and consisted of 141 rays symmetrically arranged with respect to the lens optical axis. The glass refractive index and its increments in the doped areas correspond to the wavelength of λ = 677 nm [14]. A mask with a width of w = 20 μm was used in the pre-diffusion process
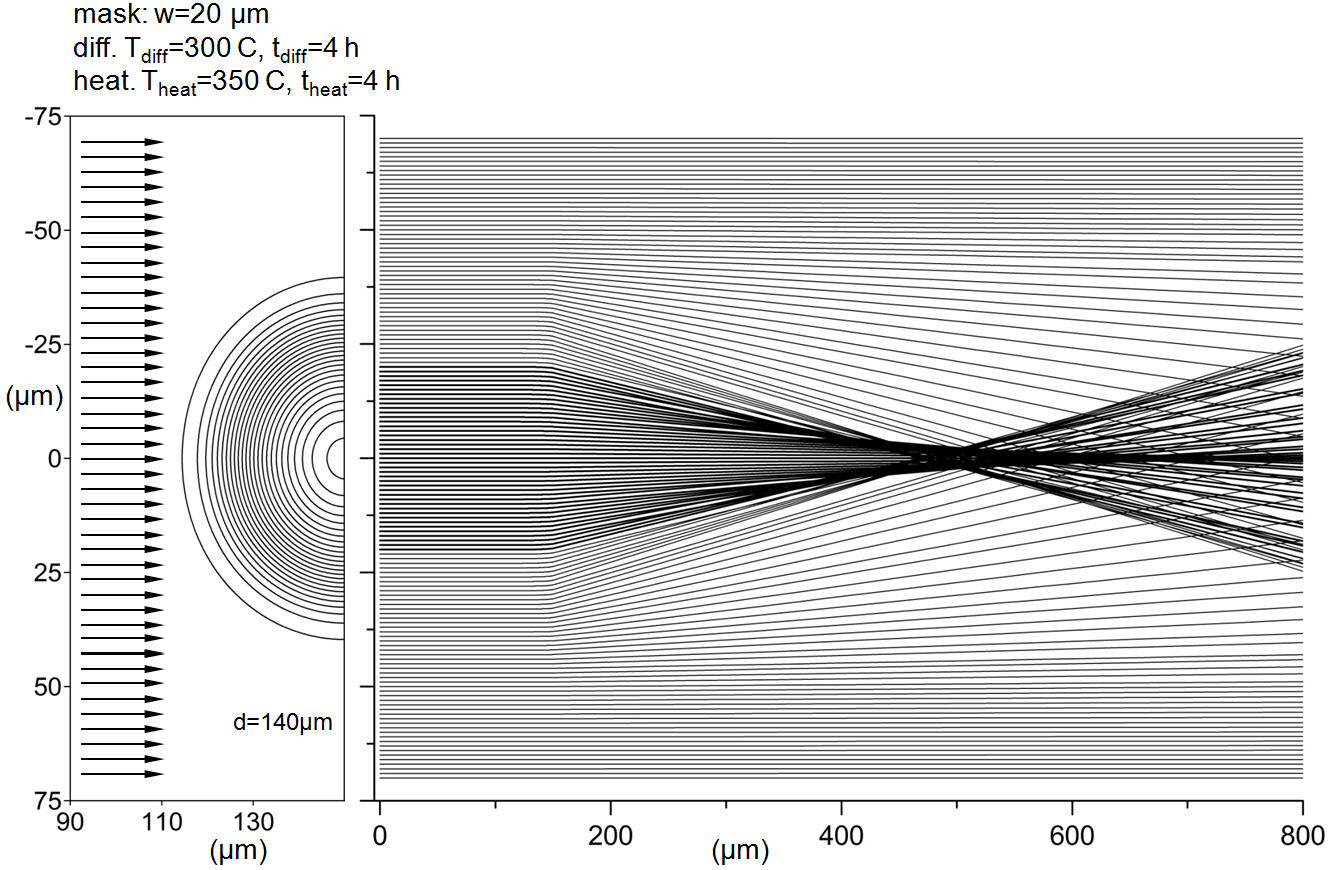
Since the area of glass in which diffusion processes change its refraction is of the order of several dozen micrometres thick, it is important which side the calculations of the beam path will be carried out on. To make the inferences about the focusing properties of the microlens independent of the influence of glass thickness, the calculations of the beam path should be started from the side of the glass surface in which the changes in refraction have not occurred (Fig. 6). Fig. 6(a) shows the course of such a beam through a lens produced in the diffusion process Tdiff= 300 °C, tdiff= 4 h and after an additional heating process Theat = 350 °C, t = 4 h [Fig. 6(b)]. The change in the glass refraction caused by the heating process, with the simultaneous enlargement of its area, clearly improves the focusing properties of the lens.
Fig. 6.Passage of a beam of rays with a width of d = 140 μm
through a lens produced in (a) the diffusion process
and (b) after the heating process.
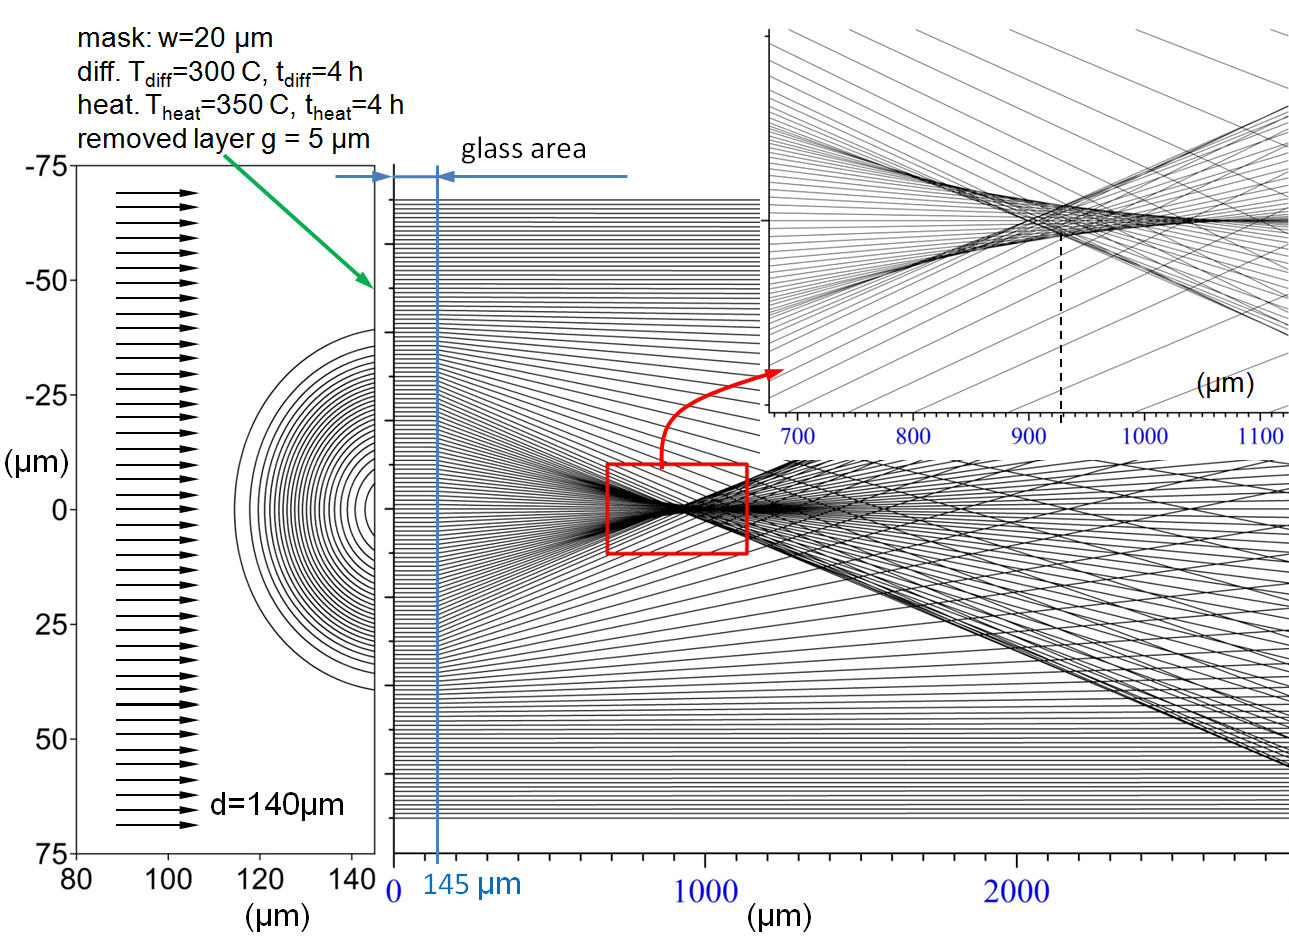
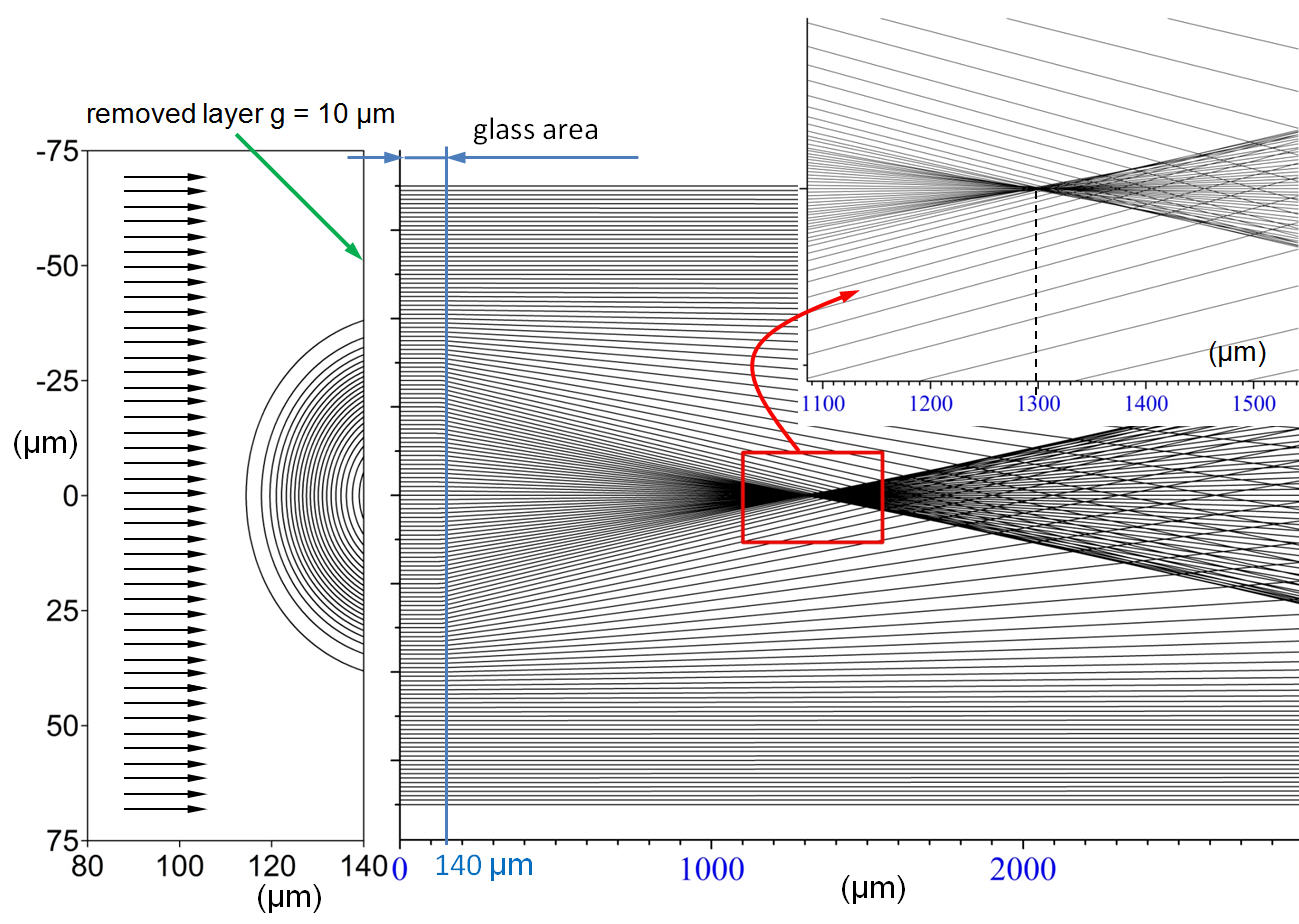
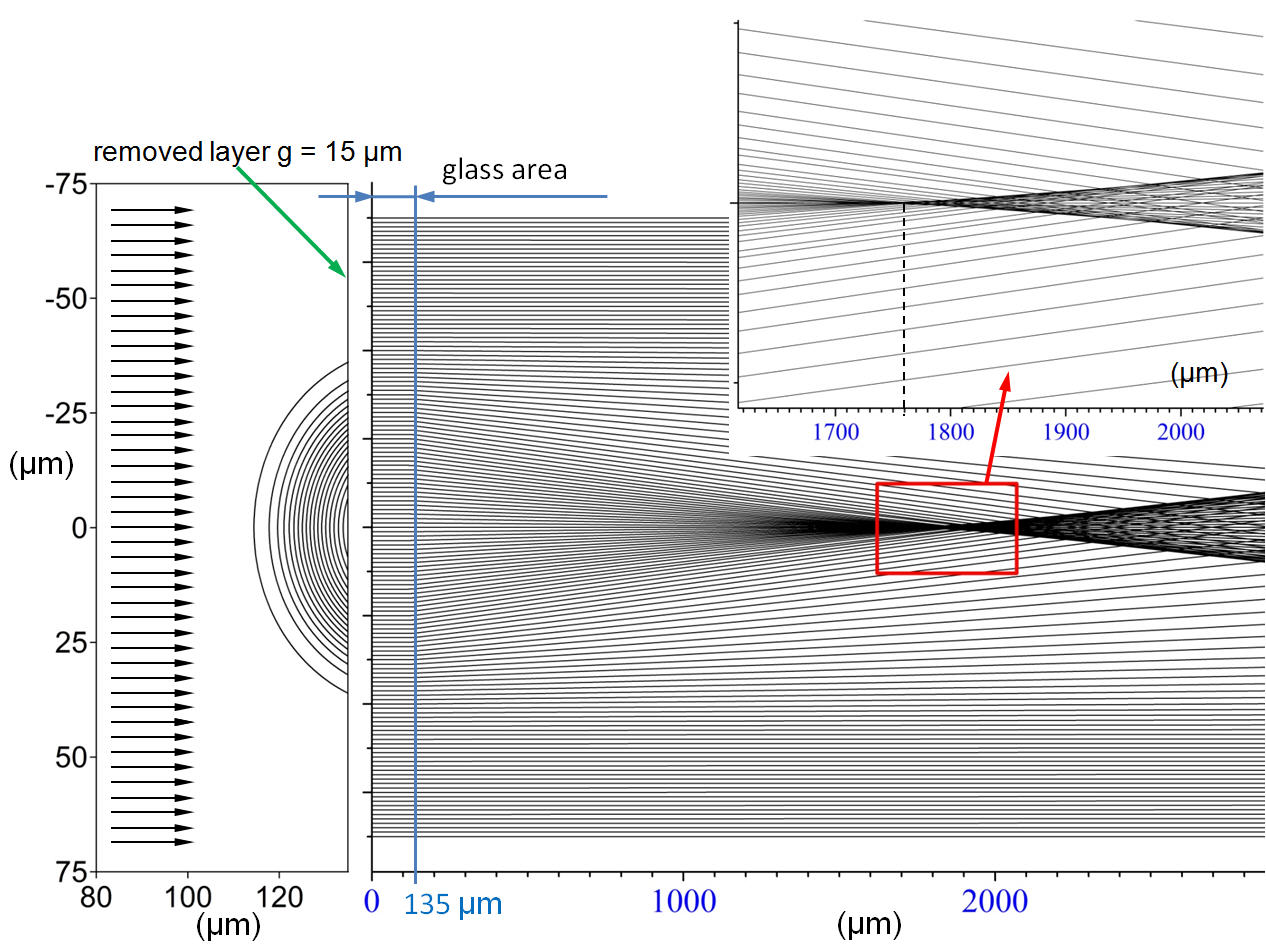
Fig. 7(a), 7(b), and 7(c) show calculations of the effect of reducing the glass thickness on the focusing properties of the lens structure. The initial structure adopted for the calculations was a lens produced in the diffusion process (Tdiff= 300 °C, tdiff= 4 h), then subjected to the heating process (Theat = 350 °C, theat = 4 h) with a refractive profile shown in Fig. 6(b). The results shown indicate a decrease in spherical aberration as lens thickness decreases. An increase in focal length accompanies this decrease. Reducing the thickness of the lens glass can be achieved mechanically (grinding plus polishing). After such processing, an immersion layer can also be applied to the glass surface. Such a layer will reduce the effects of scattering on micro-irregularities resulting from mechanical processing.
Fig. 7.The effect of changes in lens thickness on its focusing
properties after grinding: (a) 5 μm, (b) 10 μm, and
(c) 15 μm, respectively.
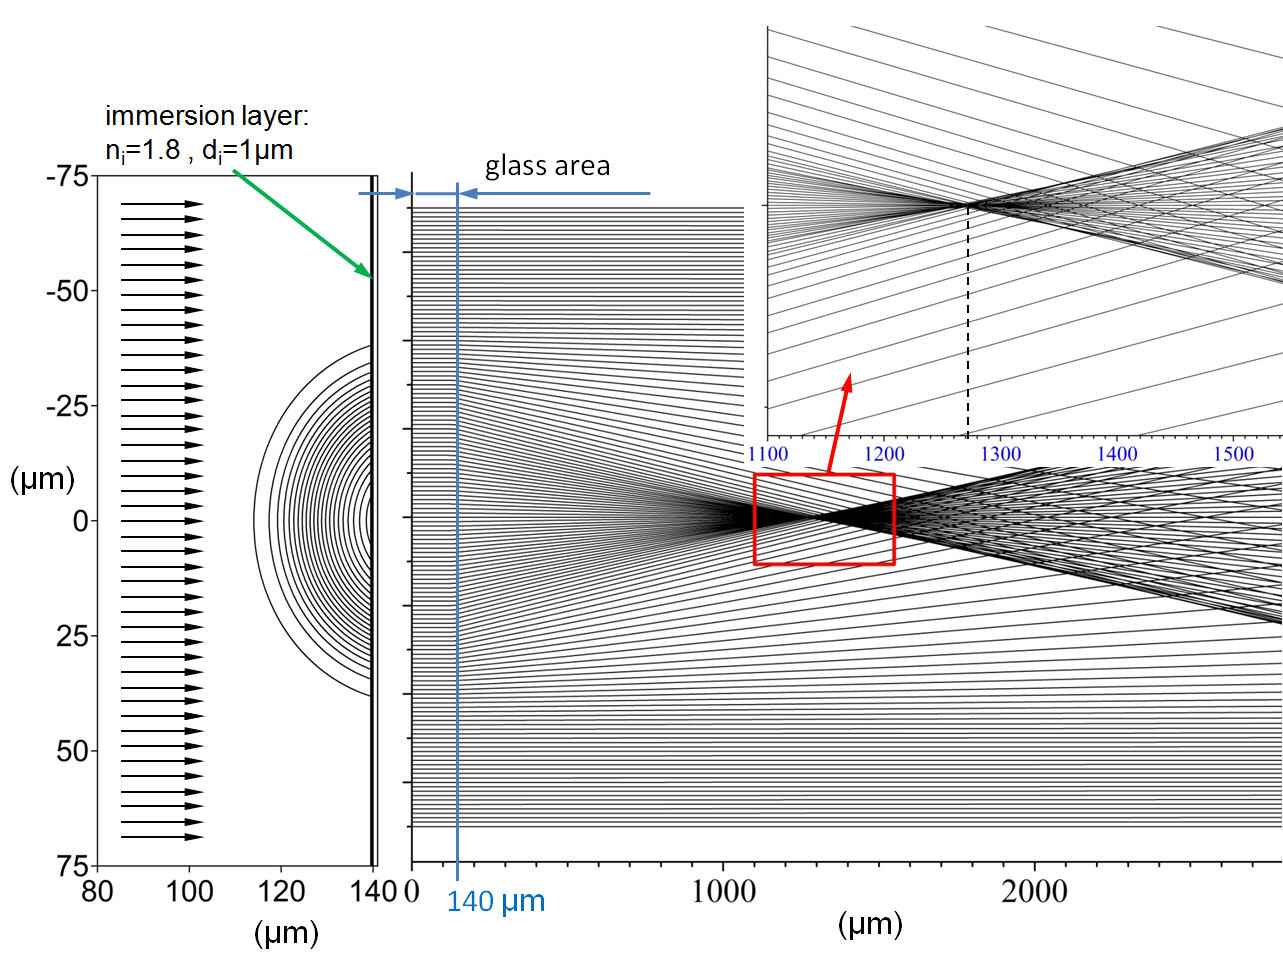
Fig. 8 shows the effect of an additional immersion layer on the focusing properties of the microlens. The calculations simulated an immersion layer with a refractive index of ni = 1.8 and a thickness of di = 1 μm. Such layers are produced by the sol-gel method [17]. This layer covered the glass surface subjected to the grinding process. The calculations performed refer to the lens in Fig. 7(b). Here, the shortening of the lens focal length is visible.
Fig. 8.The influence of the additional immersion layer on the
focusing property of the microlens
Discussion of the obtained results
Geometrical optics using ray tracing allows visualisation of the path of a beam of rays through a lens. This allows estimation of the focal length f of the lens. To obtain information about the size of the lens focal spot, the wave phenomenon of diffraction must be taken into account. The focal spot size is measured by the diameter (radius RA) of the Airy disk: RA = 1.22f λ/D, where λ is the wavelength, and D is the aperture diameter of the lens. For a gradient lens, there is no sharp limit to its size (aperture D). To estimate the diffraction limits of the focal spot size, the aperture is assumed to be the largest ray distance in a parallel beam for which the direction of travel through the lens does not change. Table 1 below summarises the results of such focal spot size estimations for the lenses shown in Fig. 7.
Diffractive limitation of the lens focal spot size.
Grinding (μm)
f (μm)
D (μm)
RA (μm)
5
785
138
4.7
10
1160
136
7.0
15
1625
134
10.0
Conclusions
This article explores the potential application of the well-established ion exchange technology in glass to create flat, gradient microlenses. A wavelength of λ = 677 nm was chosen for numerical calculations of the refractive profiles.
This choice is based on experimental data from measure-ments of planar optical waveguides performed at this wavelength. Of course, calculations can also be performed for other wavelengths. In such cases, the chromatic dispersion of the substrate glass and the doped region in the glass must be taken into account. Geometrical optics (ray tracing) was used to analyse the refractive properties of such lenses. This method allows for economical (computa-tional time) determination of the refractive properties of microlenses. Analysis of ray trajectories enables the easy determination of the lens focal length and the estimation of its aperture diameter. Visualisation of ray trajectories enables the observation of the effect of changes in lens thickness on reducing spherical aberration. Determining the focal spot size requires an approach based on wave optics. The focal spot size is measured using the radius of the Airy disk.
The obtained results demonstrate the potential for applying this method in the applications mentioned above. Changes in glass refraction and kinetics of diffusion processes make the discussed method suitable for producing planar microlenses with diameters of the order of several dozen micrometres. This results from the fact that the shapes of areas with changed refraction are the effect of the isotropic phenomenon of diffusion processes. The pre-diffusion processes are of great importance here, in which the diameter of the applied mask opening determines the shape and size of the doped glass area. Depending on the temperature and duration of the process, secondary heating processes enable the creation of surfaces with a constant refraction in glass shapes similar to hemispheres. Simple technological procedures (surface grinding) allow for obtaining good focusing properties. The produced micro-lenses are elements of flat glass substrates. They can therefore be used to form entire matrices for various applications.
Despite the limitations associated with relatively small changes in glass refraction, this method, due to its simplicity and low cost, can complement other techno-logical processes used in the production of microlenses.
Ottevaere, H. et al. Comparing glass and plastic refractive micro-lenses fabricated with different technologies. J. Opt. A: Pure Appl.Opt. 8, 407–429 (2006). https://doi.org/10.1088/1464-4258/8/7/S18
Oikawa, M. Iga, K., Sanada, T., Yamamoto, N. & Nishizawa, K. Array of distributed-index planar micro-lenses prepared from ion exchange technique. Jpn. J. Appl. Phys. 20, 296–298 (1981). https://doi.org/10.1143/JJAP.20.L296
Borelli, N. F., Morse, D. L., Bellman, R. H. & Morgan, W. L. Photolytic technique for producing microlenses in photosensitive glass. Appl. Opt. 24, 2520–2525 (1985). https://doi.org/10.1364/AO.24.002520
Weigel, Ch. et al. Perspectives of reactive ion etching of silicate glasses for optical microsystems. J. Opt. Microsyst. 1, 040901 (2021). https://doi.org/10.1117/1.JOM.1.4.040901
Nieto, D., Flores-Arias, M. T., O’Connor, G. M. & Gomez-Reino,C. Laser direct-write technique for fabricating microlens arrays on soda-lime glass with a Nd:YVO4 laser. Appl. Opt. 49, 4979–4983 (2010). https://doi.org/10.1364/AO.49.004979
Popovic, Z. D., Sprague, R. A. & Connell, G. A. Technique for monolithic fabrication of microlens arrays. Appl. Opt. 27, 1281–1284 (1988). https://doi.org/10.1364/AO.27.001281
Grigaliūnas, V. et al. Microlens fabrication by 3D electron beam lithography combined with thermal reflow technique. Microelectron. Eng. 164, 23–29 (2016). https://doi.org/10.1016/j.mee.2016.07.003
Yuan, W., Li, L.-H., Li, W.-B. & Chan, C.-Y. Fabrication of microlens array and its application: A review. Chin. J. Mech. Eng. 31, 16 (2018). https://doi.org/10.1186/s10033-018-0204-y
Kasztelaniec, R. et al. Fabrication and characterization of micro-lenses made of tellurite and heavy metal oxide glass developed with hot embossing technology. Opt. Quantum Electron. 46, 541–552 (2014). https://doi.org/10.1007/s11082-013-9811-0
Bogucki, A. et al. Ultra-long-working-distance spectroscopy of single nanostructures with aspherical solid immersion microlenses. Light Sci. Appl. 9, 48 (2020). https://doi.org/10.1038/s41377-020-0284-1
Rogoziński, R. Predictive control of ion exchange processes in glasses. Prz. Elektrotech. 99, 269–273 (2023). https://doi.org/10.15199/48.2023.10.56 [in Polish]
Rogoziński, R. Producibility of the ion-exchange method in manufacturing gradient refractive index in glass. Bull. Pol. Acad. Sci. Tech. Sci. 62, 655–665 (2014). https://doi.org/10.2478/bpasts-2014-0072
Rogoziński, R. Ion Exchange in Glass – The Changes of Glass Refraction. in Ion Exchange Technologies (Ed. Kilislioğlu, A.) 155–190 (InTech, 2012). https://doi.org/10.5772/51427
Pluta, M. Mikrointerferometria w Świetle Spolaryzowanym. (Wydawnictwa Naukowo Techniczne, 1990). [in Polish]
Zięba, M. et al. High refractive index silica-titania films fabricated via the sol–gel method and dip-coating technique-physical and chemical characterization. Materials 14, 7125 (2021). https://doi.org/10.3390/ma14237125